Politics
The Official and Ceremonial Vehicles of World Leaders
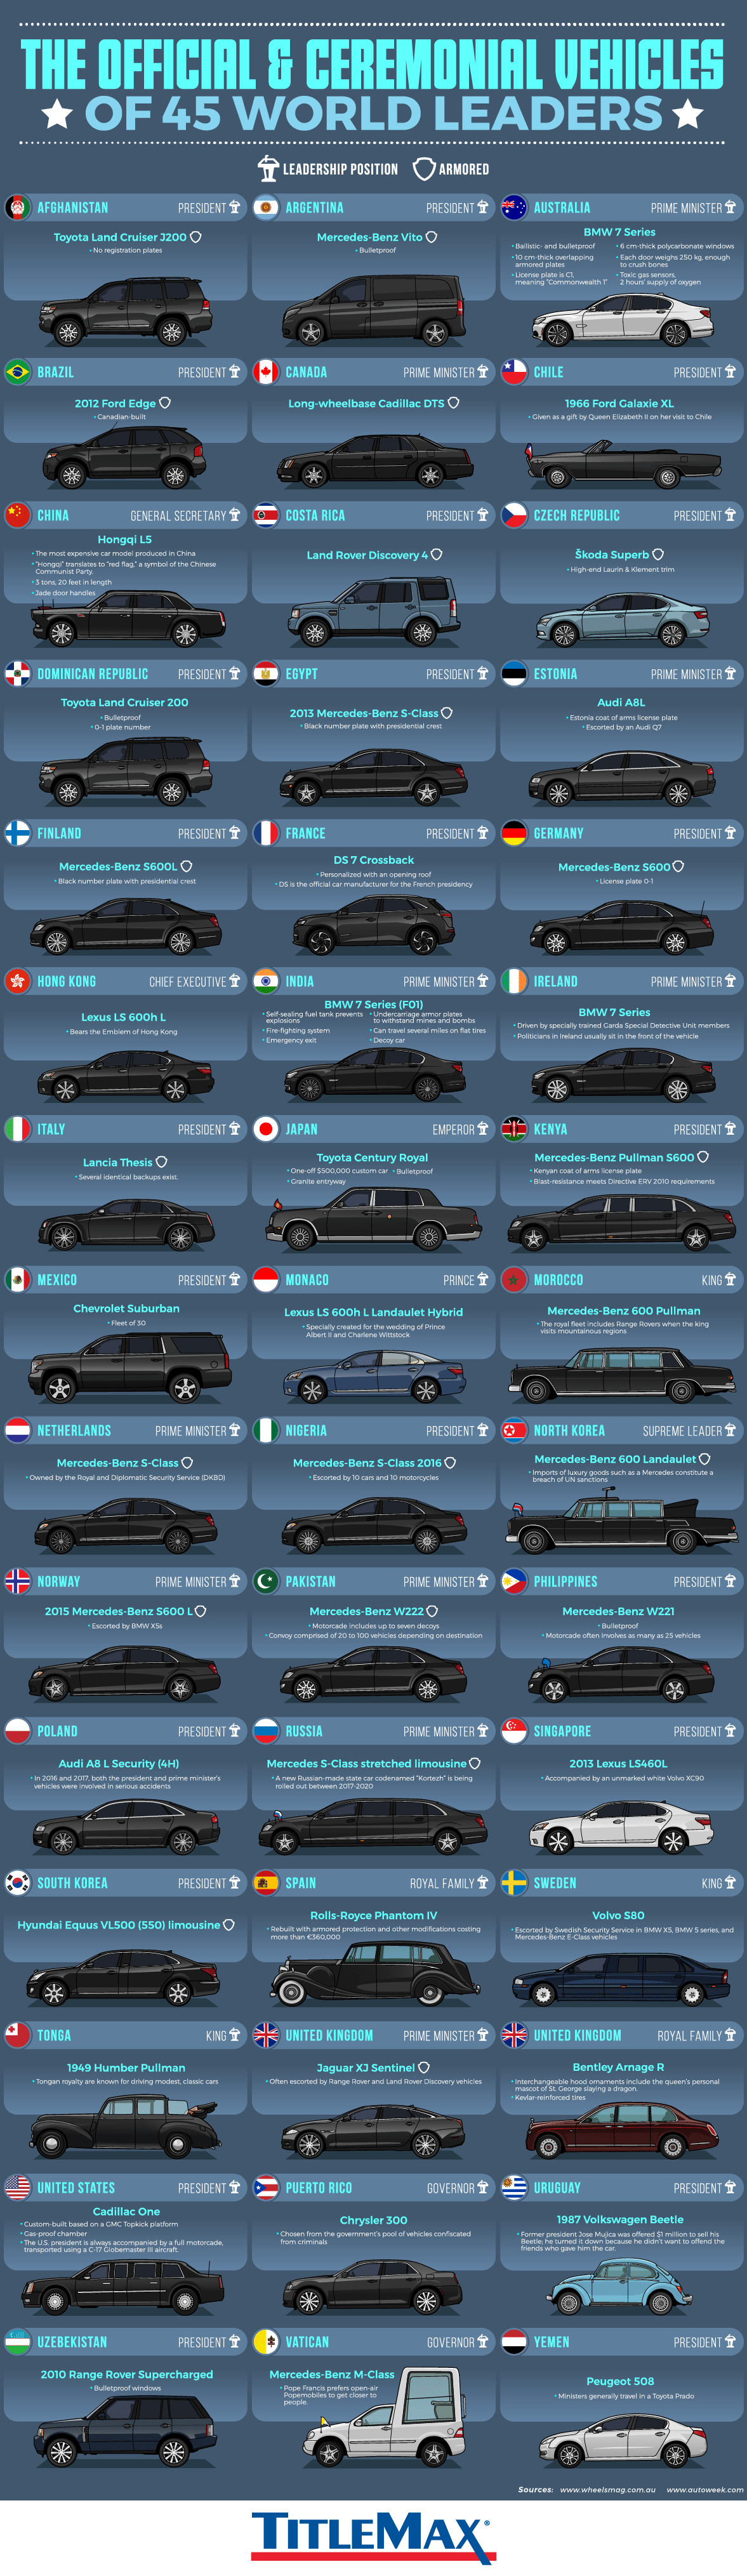
Transporting world leaders from A-to-B is a complex endeavor, usually accomplished using motorcades, escorts, roadblocks, and all sorts of bullet and bombproof vehicles. Incorporating that level of technological sophistication into a stylish vehicle worthy of transporting and head of state is no easy task.
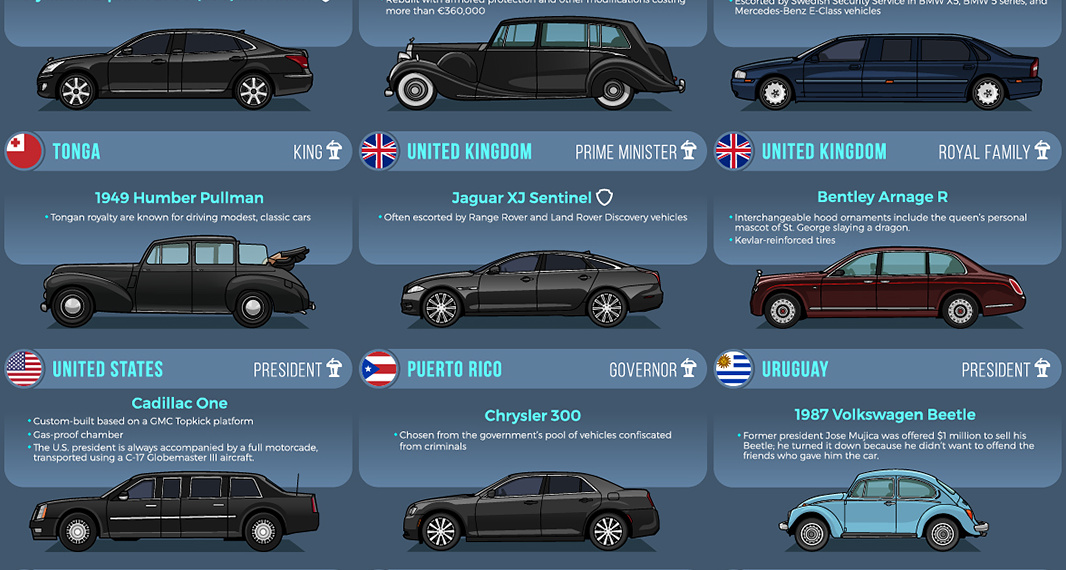
Today’s graphic looks at official state vehicles, from the unparalleled Cadillac One that transports President Trump, to the understated ’87 Volkswagen Beetle driven by former Uruguayan president, Josรจ Mujica.
The Official Official Vehicle
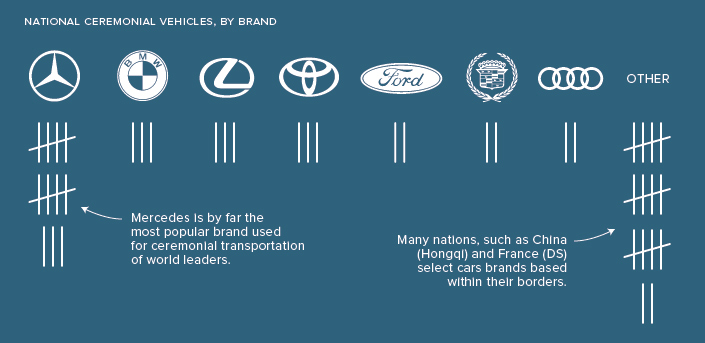
According to data from TitleMax, the overwhelming favorite car brand for world leaders is MercedesโBenz, particularly the S-Class.
Many countries use luxury brands such as MercedesโBenz and BMW to transport their heads of state, though it’s also a popular move select domestic brands for such an important and highly symbolic task. The United States, Japan, China, Germany, United Kingdom, France, and Sweden are all examples of countries that chose vehicles made by domestic brands.
Safety First
The United States spares little expense in keeping the president safe, and President Trump’s Cadillac One, nicknamed “The Beast“, is no exception.
As one would expect, the vehicle is heavily armored, with doors that weigh as much as the ones on a Boeing 757. There are also some unique features packed into the vehicle, such as tear gas launchers, and pints of blood that match the president’s blood type.
Australia’s Prime Minister, Malcolm Turnbull, rides in a BMW 7 Series that boasts some impressive safety features, including on-board oxygen supply and toxic gas sensors.
Old School Cool
While many nations fleets consist of modern luxury vehicles, some heads of state opt for vintage rides.
The former King of Tonga, George Tupou V, preferred traveling in vintage cars, such as a 1949 Humber Pullman and his customized London taxi.
An English taxi is extremely easy to get in and out of wearing a sword, a spiked helmet or spurs.
The Rolls-Royce Phantom IV is, in some ways, the quintessential vehicle for pomp and circumstance. Only 18 of the vehicles were made between 1950 and 1956, and all were purchased by royal families and heads of state. Three of these historical vehicles are still in use by the Spanish head of state for ceremonial occasions.
During special events, Chilean leaders cruise in a 1966 Ford Galaxie. The car, which has been in use for decades, was a gift from the Queen Elizabeth II.
Going Dutch
Prime Minister of the Netherlands, Mark Rutte, occasionally ditches his MercedesโBenz S-Class to ride his bike to meetings. That may seem unusual in some parts of the world, but not in the Netherlands where nearly a quarter of the country’s population rides a bicycle on any given day.
War
Interactive: Comparing Military Spend Around the World
Which countries have the highest military spend relative to their economy? This visual breaks down the amount spent in each country by GDP.

Comparing Military Spend Around the World
One of the easiest ways to identify a nationโs priorities is by tracking its expenditures, and military spend is no different.
Usually spending is measured, and ranked, in absolute amounts. For example, countries around the world collectively spent $2.1 trillion on their militaries in 2021, with the most coming from the U.S. ($800 billion), China ($293 billion), and India ($77 billion).
But these eye-popping figures are best understood in the context of each country’s economy. Using data from the Stockholm International Peace Research Institute (SIPRI), Varun Jain has visualized 158 countries’ military expenditures, both as a percentage of their total GDP as well as in average per-capita spend.
Countriesโ Military Spend as a Percentage of their Economy
To begin, Jain identified three categories of military expenditure as a percent of GDP, using the five-year (2018โ2022) average for more consistent data:
Military Spend | % of GDP | Countries |
---|---|---|
High | Above 5% | 7 |
Medium | 2โ5% | 44 |
Low | Below 2% | 107 |
Under this categorization, the stand outs are the countries spending an outsized amount of their economic output on military, rather than the highest total spenders in absolute terms.
At the top of the table is Ukraine, which has earmarked a staggering average of 9.46% of its total economic output on defense over the past five years. That’s well ahead of second-place Saudi Arabia, which is slightly above 8%.
In Ukraine’s case, its high ranking shows how quickly priorities can change. From 2018 to 2021, the country spent 3.2-3.8% of its GDP on its military, but the outbreak of war with Russia saw its expenditures jump to one-third of economic output.
Other countries from the Middle East and North Africa follow in this tier, with Oman third at 8.11% and Qatar fourth with 5.88%. Rounding out the top seven high spenders are Algeria, Kuwait, and Israel.
Rank | Country | Military Spend | % of GDP |
---|---|---|---|
1 | ๐บ๐ฆ Ukraine | High | 9.46% |
2 | ๐ธ๐ฆ Saudi Arabia | High | 8.19% |
3 | ๐ด๐ฒ Oman | High | 8.11% |
4 | ๐ถ๐ฆ Qatar | High | 5.88% |
5 | ๐ฉ๐ฟ Algeria | High | 5.70% |
6 | ๐ฐ๐ผ Kuwait | High | 5.66% |
7 | ๐ฎ๐ฑ Israel | High | 5.09% |
8 | ๐ฏ๐ด Jordan | Medium | 4.81% |
9 | ๐ฆ๐ฒ Armenia | Medium | 4.53% |
10 | ๐ฆ๐ฟ Azerbaijan | Medium | 4.53% |
11 | ๐ฑ๐ง Lebanon | Medium | 4.01% |
12 | ๐ท๐บ Russia | Medium | 3.98% |
13 | ๐ง๐ญ Bahrain | Medium | 3.79% |
14 | ๐ต๐ฐ Pakistan | Medium | 3.75% |
15 | ๐ฒ๐ฆ Morocco | Medium | 3.72% |
16 | ๐บ๐ฟ Uzbekistan | Medium | 3.56% |
17 | ๐บ๐ธ U.S. | Medium | 3.48% |
18 | ๐จ๐ด Colombia | Medium | 3.24% |
19 | ๐ฌ๐ท Greece | Medium | 3.15% |
20 | ๐ณ๐ฆ Namibia | Medium | 3.09% |
21 | ๐ง๐ณ Brunei | Medium | 3.09% |
22 | ๐ธ๐ธ South Sudan | Medium | 3.05% |
23 | ๐น๐ฌ Togo | Medium | 3.03% |
24 | ๐ฒ๐ฑ Mali | Medium | 2.90% |
25 | ๐จ๐บ Cuba | Medium | 2.88% |
26 | ๐ธ๐ฌ Singapore | Medium | 2.86% |
27 | ๐ง๐ผ Botswana | Medium | 2.86% |
28 | ๐ฒ๐ฒ Myanmar | Medium | 2.76% |
29 | ๐ง๐ซ Burkina Faso | Medium | 2.70% |
30 | ๐ฎ๐ถ Iraq | Medium | 2.69% |
31 | ๐ฐ๐ท South Korea | Medium | 2.69% |
32 | ๐จ๐ฌ Republic of Congo | Medium | 2.68% |
33 | ๐น๐ฉ Chad | Medium | 2.66% |
34 | ๐ฎ๐ณ India | Medium | 2.58% |
35 | ๐น๐ณ Tunisia | Medium | 2.58% |
36 | ๐ช๐จ Ecuador | Medium | 2.34% |
37 | ๐ฎ๐ท Iran | Medium | 2.32% |
38 | ๐ป๐ณ Viet Nam | Medium | 2.28% |
39 | ๐ฐ๐ญ Cambodia | Medium | 2.26% |
40 | ๐ฒ๐ท Mauritania | Medium | 2.24% |
41 | ๐ณ๐ช Niger | Medium | 2.21% |
42 | ๐ง๐ฎ Burundi | Medium | 2.21% |
43 | ๐น๐ท Turkey | Medium | 2.19% |
44 | ๐ต๐ฑ Poland | Medium | 2.17% |
45 | ๐ฑ๐ป Latvia | Medium | 2.14% |
46 | ๐ฑ๐น Lithuania | Medium | 2.13% |
47 | ๐ช๐ช Estonia | Medium | 2.13% |
48 | ๐ฌ๐ง United Kingdom | Medium | 2.12% |
49 | ๐บ๐พ Uruguay | Medium | 2.11% |
50 | ๐ท๐ธ Serbia | Medium | 2.06% |
51 | ๐บ๐ฌ Uganda | Medium | 2.02% |
52 | ๐ญ๐ท Croatia | Low | 1.97% |
53 | ๐ฆ๐บ Australia | Low | 1.93% |
54 | ๐จ๐ฑ Chile | Low | 1.92% |
55 | ๐ซ๐ท France | Low | 1.91% |
56 | ๐จ๐พ Cyprus | Low | 1.90% |
57 | ๐ท๐ด Romania | Low | 1.87% |
58 | ๐ง๐ฌ Bulgaria | Low | 1.85% |
59 | ๐ธ๐ฟ Eswatini | Low | 1.82% |
60 | ๐ณ๐ด Norway | Low | 1.81% |
61 | ๐จ๐ซ Central African Republic | Low | 1.78% |
62 | ๐ฑ๐ฐ Sri Lanka | Low | 1.77% |
63 | ๐ต๐น Portugal | Low | 1.77% |
64 | ๐น๐ผ Taiwan | Low | 1.76% |
65 | ๐จ๐ณ China | Low | 1.72% |
66 | ๐ฌ๐ช Georgia | Low | 1.71% |
67 | ๐ธ๐ฐ Slovakia | Low | 1.67% |
68 | ๐ฌ๐ผ Guinea-Bissau | Low | 1.65% |
69 | ๐ฐ๐ฌ Kyrgyzstan | Low | 1.62% |
70 | ๐ฌ๐ณ Guinea | Low | 1.61% |
71 | ๐ซ๐ฎ Finland | Low | 1.60% |
72 | ๐ธ๐ณ Senegal | Low | 1.58% |
73 | ๐ญ๐ณ Honduras | Low | 1.56% |
74 | ๐ฌ๐ฆ Gabon | Low | 1.56% |
75 | ๐ฒ๐ฟ Mozambique | Low | 1.56% |
76 | ๐ฑ๐ธ Lesotho | Low | 1.56% |
77 | ๐ฒ๐ช Montenegro | Low | 1.54% |
78 | ๐ซ๐ฏ Fiji | Low | 1.54% |
79 | ๐ฏ๐ฒ Jamaica | Low | 1.49% |
80 | ๐ฆ๐ด Angola | Low | 1.48% |
81 | ๐ฎ๐น Italy | Low | 1.48% |
82 | ๐ญ๐บ Hungary | Low | 1.48% |
83 | ๐ง๐ด Bolivia | Low | 1.46% |
84 | ๐ธ๐จ Seychelles | Low | 1.43% |
85 | ๐ณ๐ฑ Netherlands | Low | 1.41% |
86 | ๐ธ๐ฉ Sudan | Low | 1.39% |
87 | ๐ท๐ผ Rwanda | Low | 1.39% |
88 | ๐ณ๐ต Nepal | Low | 1.36% |
89 | ๐ฉ๐ฐ Denmark | Low | 1.36% |
90 | ๐ฆ๐ฑ Albania | Low | 1.34% |
91 | ๐ช๐ธ Spain | Low | 1.34% |
92 | ๐น๐ญ Thailand | Low | 1.33% |
93 | ๐ฆ๐ซ Afghanistan | Low | 1.33% |
94 | ๐ณ๐ฟ New Zealand | Low | 1.32% |
95 | ๐จ๐ฆ Canada | Low | 1.32% |
96 | ๐ฉ๐ช Germany | Low | 1.31% |
97 | ๐ฒ๐ฐ North Macedonia | Low | 1.30% |
98 | ๐ง๐ท Brazil | Low | 1.29% |
99 | ๐ง๐ฟ Belize | Low | 1.28% |
100 | ๐ธ๐ป El Salvador | Low | 1.28% |
101 | ๐ง๐ฉ Bangladesh | Low | 1.26% |
102 | ๐ฟ๐ฒ Zambia | Low | 1.25% |
103 | ๐ฌ๐ถ Equatorial Guinea | Low | 1.24% |
104 | ๐ฌ๐พ Guyana | Low | 1.22% |
105 | ๐จ๐ฎ Cote d'Ivoire | Low | 1.22% |
106 | ๐ช๐ฌ Egypt | Low | 1.20% |
107 | ๐ต๐ช Peru | Low | 1.20% |
108 | ๐ง๐พ Belarus | Low | 1.18% |
109 | ๐ธ๐ช Sweden | Low | 1.17% |
110 | ๐ฐ๐ช Kenya | Low | 1.13% |
111 | ๐ธ๐ฎ Slovenia | Low | 1.10% |
112 | ๐น๐ฑ Timor Leste | Low | 1.08% |
113 | ๐น๐ฟ Tanzania | Low | 1.05% |
114 | ๐จ๐ฒ Cameroon | Low | 1.04% |
115 | ๐น๐ฏ Tajikistan | Low | 1.03% |
116 | ๐ฏ๐ต Japan | Low | 1.03% |
117 | ๐ง๐ช Belgium | Low | 1.02% |
118 | ๐ฑ๐ท Liberia | Low | 1.00% |
119 | ๐ฒ๐พ Malaysia | Low | 0.98% |
120 | ๐ต๐ญ Philippines | Low | 0.96% |
121 | ๐ต๐พ Paraguay | Low | 0.95% |
122 | ๐ฝ๐ฐ Kosovo | Low | 0.95% |
123 | ๐ฟ๐ฆ South Africa | Low | 0.94% |
124 | ๐ฒ๐ผ Malawi | Low | 0.92% |
125 | ๐ง๐ฆ Bosnia and Herzegovina | Low | 0.84% |
126 | ๐ฐ๐ฟ Kazakhstan | Low | 0.83% |
127 | ๐ฆ๐น Austria | Low | 0.78% |
128 | ๐ฌ๐ฒ Gambia | Low | 0.76% |
129 | ๐น๐น Trinidad & Tobago | Low | 0.75% |
130 | ๐ฎ๐ฉ Indonesia | Low | 0.74% |
131 | ๐จ๐ญ Switzerland | Low | 0.73% |
132 | ๐จ๐ฟ Czech Republic | Low | 0.71% |
133 | ๐ฉ๐ด Dominican Republic | Low | 0.70% |
134 | ๐ฒ๐ณ Mongolia | Low | 0.69% |
135 | ๐ฒ๐ฌ Madagascar | Low | 0.68% |
136 | ๐จ๐ฉ Dem. Rep. of Congo | Low | 0.64% |
137 | ๐ณ๐ฌ Nigeria | Low | 0.64% |
138 | ๐ช๐น Ethiopia | Low | 0.64% |
139 | ๐ธ๐ฑ Sierra Leone | Low | 0.64% |
140 | ๐ฆ๐ท Argentina | Low | 0.63% |
141 | ๐ฑ๐บ Luxembourg | Low | 0.61% |
142 | ๐ฒ๐ฝ Mexico | Low | 0.61% |
143 | ๐ณ๐ฎ Nicaragua | Low | 0.60% |
144 | ๐จ๐ป Cape Verde | Low | 0.54% |
145 | ๐ง๐ฏ Benin | Low | 0.54% |
146 | ๐ฒ๐น Malta | Low | 0.48% |
147 | ๐ฌ๐น Guatemala | Low | 0.45% |
148 | ๐ฌ๐ญ Ghana | Low | 0.43% |
149 | ๐ต๐ฌ Papua New Guinea | Low | 0.38% |
150 | ๐ฒ๐ฉ Moldova | Low | 0.36% |
151 | ๐ฎ๐ช Ireland | Low | 0.27% |
152 | ๐ฟ๐ผ Zimbabwe | Low | 0.26% |
153 | ๐ป๐ช Venezuela | Low | 0.20% |
154 | ๐ญ๐น Haiti | Low | 0.17% |
155 | ๐ฒ๐บ Mauritius | Low | 0.16% |
156 | ๐จ๐ท Costa Rica | Low | 0.00% |
157 | ๐ฎ๐ธ Iceland | Low | 0.00% |
158 | ๐ต๐ฆ Panama | Low | 0.00% |
The medium group consists of 44 countries and is led by four nations (Jordan, Armenia, Azerbaijan, and Lebanon) that all spend more than 4% of their GDP on their militaries. Other familiar countries known to have large military budgets, like Russia, Pakistan, the U.S., India and the UK, are also in this category.
The low spend group has a total of 107 countries, but also contains some surprises. For example, China, France, and Germanyโall in the top 10 countries by absolute military spendโactually have similar amounts of military spend as a percent of GDP as Georgia, Cyprus, and North Macedonia respectively.
At the bottom of the table are countries with either low military importance, or strange technicalities. For example, Mauritius is one of the countries with the lowest military budgets because it doesn’t officially have a standing military, instead relying on two paramilitary forces (a special mobile force and a Coast Guard).
Similarly, Iceland allocates 0% of its GDP towards military spending. In place of a standing army, the country maintains a specialized peacekeeping force, a substantial Coast Guard, and relies on security alliances within NATO, of which it is a member and provides financial support to.
Ranking Defense Spending Per Capita
While the measure above equalizes military spend on economic strength, per-capita military spending shows how much countries allocate while accounting for population size.
On a per-capita basis (again using a five-year average), Qatar leads the ranks with a per-capita spend of $4,564, well-ahead of Israel at $2,535, and Saudi Arabia at $1,928.
Rank | Country | Per Capita Spend ($) |
---|---|---|
1 | ๐ถ๐ฆ Qatar | $4,564 |
2 | ๐ฎ๐ฑ Israel | $2,535 |
3 | ๐ธ๐ฆ Saudi Arabia | $1,928 |
4 | ๐ธ๐ฌ Singapore | $1,837 |
5 | ๐ฐ๐ผ Kuwait | $1,815 |
6 | ๐บ๐ธ U.S. | $1,815 |
7 | ๐ณ๐ด Norway | $1,438 |
8 | ๐ด๐ฒ Oman | $1,254 |
9 | ๐ฆ๐บ Australia | $1,131 |
10 | ๐ง๐ณ Brunei | $959 |
11 | ๐ฌ๐ง UK | $913 |
12 | ๐ฐ๐ท South Korea | $894 |
13 | ๐ง๐ญ Bahrain | $863 |
14 | ๐ฉ๐ฐ Denmark | $861 |
15 | ๐ซ๐ท France | $811 |
16 | ๐ซ๐ฎ Finland | $801 |
17 | ๐ณ๐ฑ Netherlands | $765 |
18 | ๐ฑ๐บ Luxembourg | $694 |
19 | ๐ธ๐ช Sweden | $662 |
20 | ๐จ๐ญ Switzerland | $647 |
21 | ๐จ๐ฆ Canada | $645 |
22 | ๐ฌ๐ท Greece | $629 |
23 | ๐ฉ๐ช Germany | $623 |
24 | ๐ณ๐ฟ New Zealand | $610 |
25 | ๐ช๐ช Estonia | $535 |
26 | ๐น๐ผ Taiwan | $495 |
27 | ๐ฎ๐น Italy | $494 |
28 | ๐ง๐ช Belgium | $487 |
29 | ๐ท๐บ Russia | $467 |
30 | ๐ฑ๐น Lithuania | $463 |
31 | ๐ต๐น Portugal | $417 |
32 | ๐ฑ๐ป Latvia | $405 |
33 | ๐จ๐พ Cyprus | $399 |
34 | ๐ฏ๐ต Japan | $398 |
35 | ๐ช๐ธ Spain | $395 |
36 | ๐ฆ๐น Austria | $393 |
37 | ๐ต๐ฑ Poland | $359 |
38 | ๐บ๐พ Uruguay | $354 |
39 | ๐ธ๐ฐ Slovakia | $334 |
40 | ๐ฑ๐ง Lebanon | $334 |
41 | ๐ธ๐ฎ Slovenia | $302 |
42 | ๐บ๐ฆ Ukraine | $302 |
43 | ๐ญ๐ท Croatia | $294 |
44 | ๐จ๐ฑ Chile | $292 |
45 | ๐ท๐ด Romania | $258 |
46 | ๐ญ๐บ Hungary | $248 |
47 | ๐ฎ๐ช Ireland | $235 |
48 | ๐ธ๐จ Seychelles | $230 |
49 | ๐ฆ๐ฟ Azerbaijan | $226 |
50 | ๐ฉ๐ฟ Algeria | $219 |
51 | ๐ฆ๐ฒ Armenia | $217 |
52 | ๐ง๐ผ Botswana | $215 |
53 | ๐ฏ๐ด Jordan | $207 |
54 | ๐น๐ท Turkey | $199 |
55 | ๐จ๐ด Colombia | $197 |
56 | ๐ง๐ฌ Bulgaria | $194 |
57 | ๐จ๐ณ China | $183 |
58 | ๐ฒ๐น Malta | $175 |
59 | ๐จ๐ฟ Czech Republic | $175 |
60 | ๐ฎ๐ท Iran | $169 |
61 | ๐ณ๐ฆ Namibia | $159 |
62 | ๐ฎ๐ถ Iraq | $145 |
63 | ๐ช๐จ Ecuador | $138 |
64 | ๐ฒ๐ช Montenegro | $137 |
65 | ๐ท๐ธ Serbia | $133 |
66 | ๐น๐น Trinidad & Tobago | $131 |
67 | ๐ฌ๐ฆ Gabon | $124 |
68 | ๐ฒ๐ฆ Morocco | $122 |
69 | ๐ฌ๐ถ Equatorial Guinea | $112 |
70 | ๐ฒ๐พ Malaysia | $109 |
71 | ๐ง๐ท Brazil | $107 |
72 | ๐น๐ญ Thailand | $97 |
73 | ๐ฌ๐พ Guyana | $92 |
74 | ๐น๐ณ Tunisia | $91 |
75 | ๐ซ๐ฏ Fiji | $83 |
76 | ๐ฒ๐ฐ North Macedonia | $83 |
77 | ๐ฐ๐ฟ Kazakhstan | $82 |
78 | ๐ต๐ช Peru | $81 |
79 | ๐ฌ๐ช Georgia | $80 |
80 | ๐ง๐พ Belarus | $80 |
81 | ๐ฏ๐ฒ Jamaica | $77 |
82 | ๐ฆ๐ฑ Albania | $76 |
83 | ๐ธ๐ฟ Eswatini | $72 |
84 | ๐ฑ๐ฐ Sri Lanka | $69 |
85 | ๐ฆ๐ท Argentina | $66 |
86 | ๐ง๐ฟ Belize | $60 |
87 | ๐ฒ๐ฝ Mexico | $59 |
88 | ๐ฉ๐ด Dominican Republic | $58 |
89 | ๐ป๐ณ Viet Nam | $58 |
90 | ๐ฟ๐ฆ South Africa | $56 |
91 | ๐ธ๐ป El Salvador | $54 |
92 | ๐ง๐ฆ Bosnia and Herzegovina | $54 |
93 | ๐ฎ๐ณ India | $53 |
94 | ๐จ๐ฌ Republic of Congo | $53 |
95 | ๐ต๐พ Paraguay | $52 |
96 | ๐ง๐ด Bolivia | $51 |
97 | ๐ต๐ฐ Pakistan | $49 |
98 | ๐บ๐ฟ Uzbekistan | $44 |
99 | ๐ฆ๐ด Angola | $43 |
100 | ๐ฝ๐ฐ Kosovo | $42 |
101 | ๐ฒ๐ท Mauritania | $42 |
102 | ๐ญ๐ณ Honduras | $42 |
103 | ๐ช๐ฌ Egypt | $41 |
104 | ๐ฐ๐ญ Cambodia | $36 |
105 | ๐ฒ๐ฒ Myanmar | $35 |
106 | ๐ต๐ญ Philippines | $33 |
107 | ๐ฒ๐ณ Mongolia | $33 |
108 | ๐ฎ๐ฉ Indonesia | $31 |
109 | ๐ง๐ฉ Bangladesh | $27 |
110 | ๐น๐ฑ Timor Leste | $27 |
111 | ๐ฒ๐ฑ Mali | $26 |
112 | ๐ธ๐ณ Senegal | $24 |
113 | ๐จ๐ฎ Cote d'Ivoire | $23 |
114 | ๐น๐ฌ Togo | $21 |
115 | ๐ฐ๐ช Kenya | $21 |
116 | ๐ฐ๐ฌ Kyrgyzstan | $20 |
117 | ๐ง๐ซ Burkina Faso | $20 |
118 | ๐ฌ๐ณ Guinea | $19 |
119 | ๐ฑ๐ธ Lesotho | $19 |
120 | ๐จ๐ป Cape Verde | $19 |
121 | ๐ฌ๐น Guatemala | $19 |
122 | ๐น๐ฉ Chad | $18 |
123 | ๐ธ๐ธ South Sudan | $18 |
124 | ๐ธ๐ฉ Sudan | $18 |
125 | ๐บ๐ฌ Uganda | $18 |
126 | ๐ฟ๐ผ Zimbabwe | $17 |
127 | ๐ฟ๐ฒ Zambia | $16 |
128 | ๐ฒ๐บ Mauritius | $16 |
129 | ๐จ๐ฒ Cameroon | $16 |
130 | ๐ณ๐ต Nepal | $15 |
131 | ๐ณ๐ฌ Nigeria | $14 |
132 | ๐ณ๐ฎ Nicaragua | $12 |
133 | ๐ฌ๐ผ Guinea-Bissau | $12 |
134 | ๐น๐ฟ Tanzania | $12 |
135 | ๐จ๐บ Cuba | $11 |
136 | ๐ท๐ผ Rwanda | $11 |
137 | ๐ฒ๐ฉ Moldova | $11 |
138 | ๐ต๐ฌ Papua New Guinea | $10 |
139 | ๐ณ๐ช Niger | $10 |
140 | ๐น๐ฏ Tajikistan | $9 |
141 | ๐จ๐ซ Central African Republic | $8 |
142 | ๐ฒ๐ฟ Mozambique | $8 |
143 | ๐ฌ๐ญ Ghana | $8 |
144 | ๐ง๐ฏ Benin | $7 |
145 | ๐ง๐ฎ Burundi | $7 |
146 | ๐ฆ๐ซ Afghanistan | $6 |
147 | ๐ฌ๐ฒ Gambia | $6 |
148 | ๐ช๐น Ethiopia | $5 |
149 | ๐ป๐ช Venezuela | $5 |
150 | ๐ฒ๐ผ Malawi | $4 |
151 | ๐ธ๐ฑ Sierra Leone | $3 |
152 | ๐ฒ๐ฌ Madagascar | $3 |
153 | ๐จ๐ฉ Dem. Rep. of Congo | $3 |
154 | ๐ฑ๐ท Liberia | $3 |
155 | ๐ญ๐น Haiti | $2 |
156 | ๐จ๐ท Costa Rica | $0 |
157 | ๐ฎ๐ธ Iceland | $0 |
158 | ๐ต๐ฆ Panama | $0 |
Measured this way, we get a perspective of how small defense budgets can be per person, even if the total expenditure is large.
For example, India has the fourth-highest total defense expenditure in 2022, but because of its massive population only sets aside $53 per resident for its military, putting it solidly at the bottom third of the per-capita rankings.
Patterns Revealed By Measuring Military Spend
Changing how we look at a countryโs military budget can reveal a lot more than just looking at absolute numbers.
For example, the Middle East is the region with the highest spenders on defense as a percentage of their GDP, giving us insight into regional security concerns.
Countries from the medium group of military spendingโincluding parts of Eastern Europe, sub-Saharan Africa, and South Asiaโhighlight past or recent conflict zones between neighbors, countries with internal strife, or countries wary of a regional aggressor. Ukraine’s average per capita military spend, for example, was just $122.4 from 2018 to 2021. The next year, it jumped nearly 10 times to $1,018.66 per person after Russia’s invasion.
In fact, European military spending saw its sharpest one-year jump in 30 years as a direct result of the war.
Alongside European anxieties, ongoing tension between China and Taiwan has also contributed to increased military spending in Asia and Oceania. Will these budgets continue their dramatic ascent or will they rise evenly alongside their relative economies in 2023?
Data note: For these comparisons, the creator is calculating five-year averages (using data from 2018-2022) for military spending as a percentage of GDP and per-capita military spending for each country. The military expenditure data is pulled from Stockholm International Peace Research Institute.
Data for some countries is missing or may vary significantly from official figures. Countries with up to
two years of missing data had averages calculated on the years available, while countries with three or more years of missing data have been removed from this dataset, including: Djibouti, Eritrea, North Korea, Laos, Libya, Somalia, Syria, Turkmenistan, UAE, and Yemen.
Please see SIPRI’s methodologies page for more details on how they collect their data and create estimates.
-
Mining3 weeks ago
Ranked: The World’s Biggest Steel Producers, by Country
-
Economy3 days ago
Mapped: The State of Economic Freedom in 2023
-
Visual Capitalist2 weeks ago
Join Us For Data Creator Con 2023
-
Datastream2 days ago
The 10 Longest Range EVs for 2023
-
Economy2 weeks ago
Charted: Public Trust in the Federal Reserve
-
Markets2 hours ago
Mapped: The Growth in House Prices by Country
-
Technology2 weeks ago
Ranked: The World’s Top 25 Websites in 2023
-
Misc2 mins ago
Visualized: The 4 Billion Year Path of Human Evolution