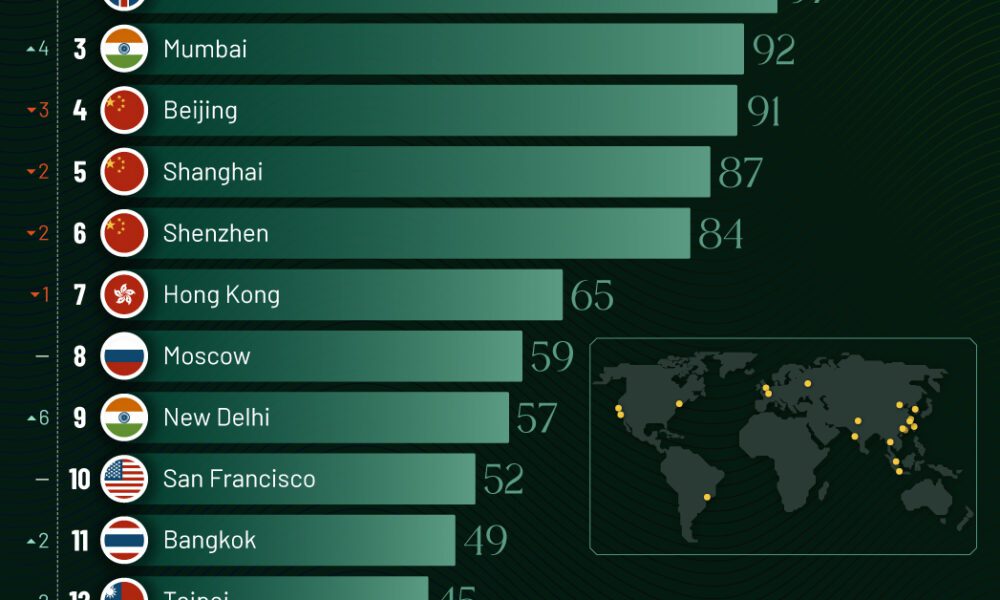
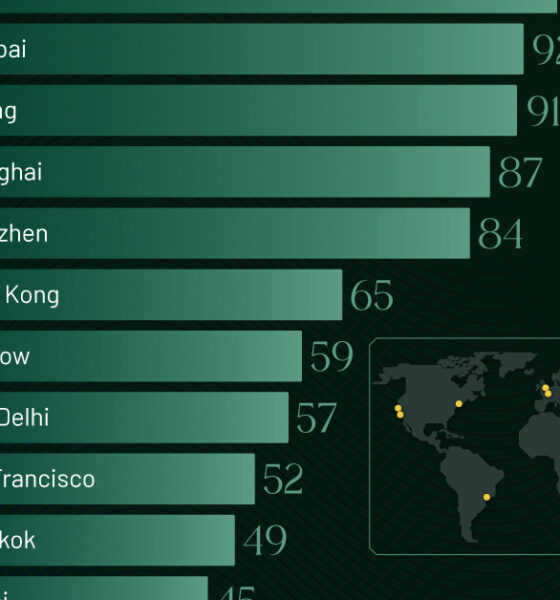
Just two countries account for half of the top 20 cities with the most billionaires. And the majority of the...
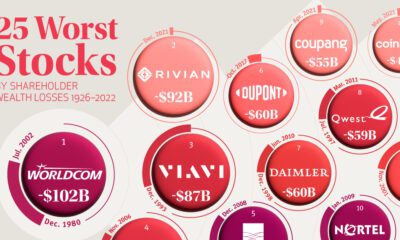

Among publicly-listed U.S. companies, the 25 worst stocks have lost shareholders a collective $1.2 trillion since 1926.
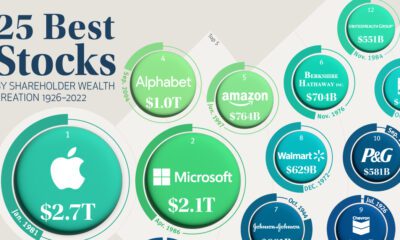

Accounting for just 0.1% of all public U.S. stocks, these companies have created nearly a third of all shareholder wealth since 1926.
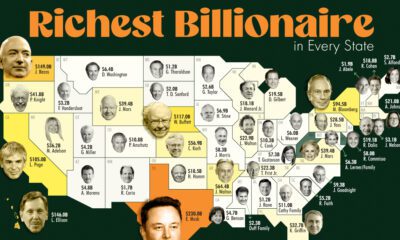

Who are the wealthiest people in the United States? This map breaks down the richest billionaires in U.S. states.


The world's millionaire population has more than doubled in the last decade between 2012 and 2022. We visualize these numbers here.


We've visualized data from the Federal Reserve to provide a comprehensive break down of U.S. assets by generation.
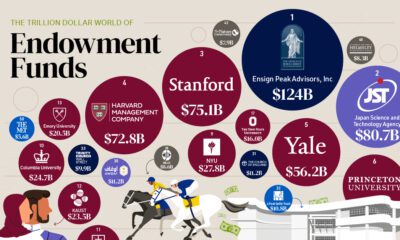

Endowment funds represent the investment arms of nonprofits. See the worlds top 50, which collectively have over $1 trillion in assets.


Analyzing 2023 per capita GDP numbers from the International Monetary Fund lets us know where the richest countries in the world are.


Analyzing 2023 per capita GDP numbers from the International Monetary Fund lets us know where the poorest countries are.
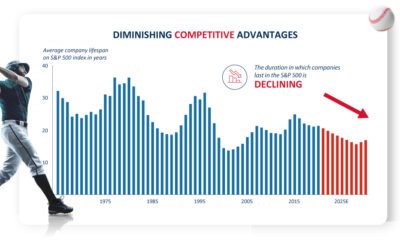

What can innovation investing learn from baseball? See how hitting home runs and singles are akin to different forms of innovation investing.


This infographic shows the net minimum wage across 67 countries, as of January 2023. A breakdown by U.S. state is also included.


