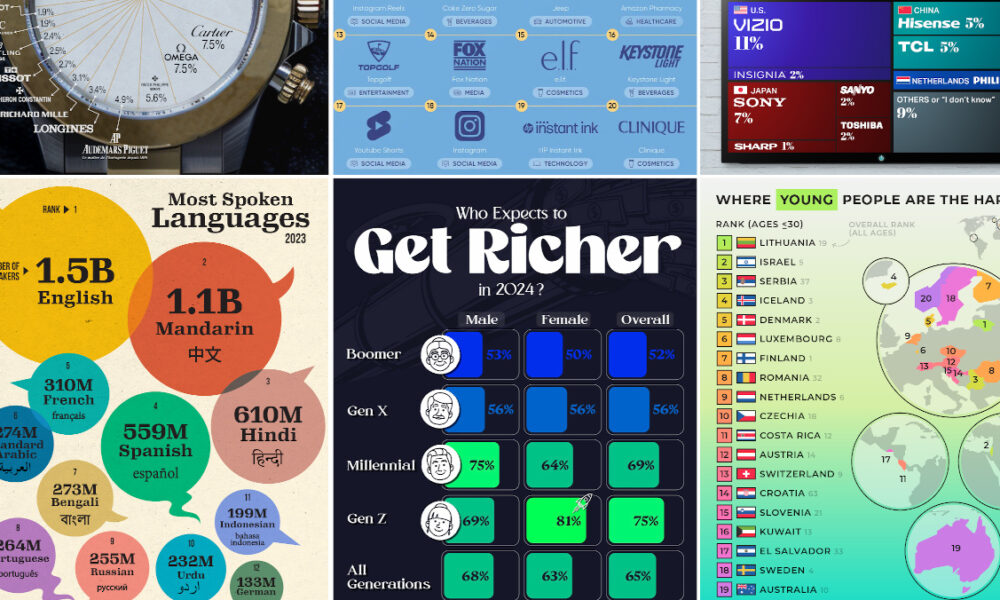
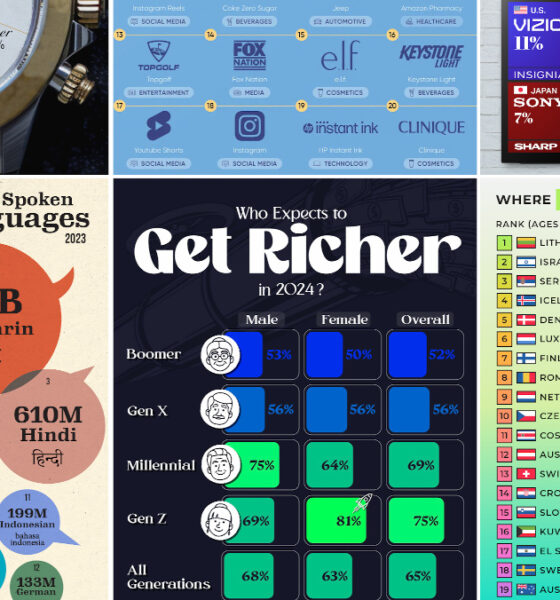
We round up the most popular, most discussed, and most liked visualizations of the month on Voronoi, our new data...


Here's a preview of our much-anticipated 2024 Global Forecast Series, the U.S. military's annual report on China and and much more.


Join the waitlist now to be one of the first to use Voronoi.


This month's VC+ special dispatches feature the economic complexity in Europe and markets this month.


This month's VC+ special dispatches feature a deep dive into BRICS’ history and markets this month.


Join VC+ Lifetime this month and get the best visual insights for the best value. See what else VC+ members receive in August!


This month's VC+ special dispatches feature an exploration of five historical maps and an exclusive Q&A with the VC Team on our upcoming app.


In this excerpt from our Markets This Month VC+ newsletter, we looked at how five portfolios of super investors shaped up at end of Q1 2023.


This month's VC+ special dispatches feature a mid-year update on how expert predictions from the start of 2023 have panned out.


How do you visualize trade? These 9 graphics on the topic are the shortlist winners of our inaugural Creator Program Challenge.


Join us June 14th for a new event by Visual Capitalist, exploring how the next generation of data creators are adapting to an increasingly mobile-first world.


