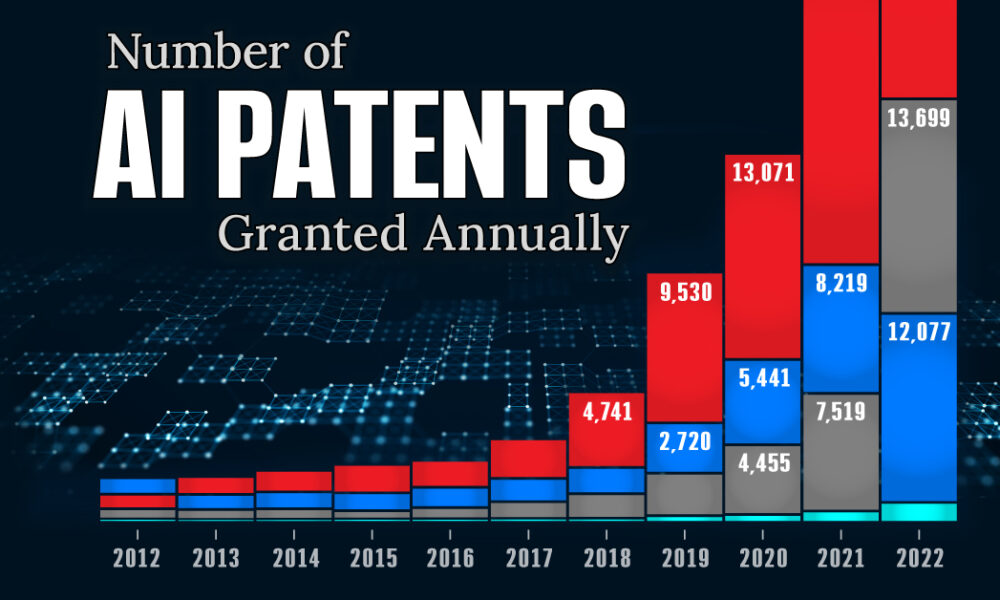
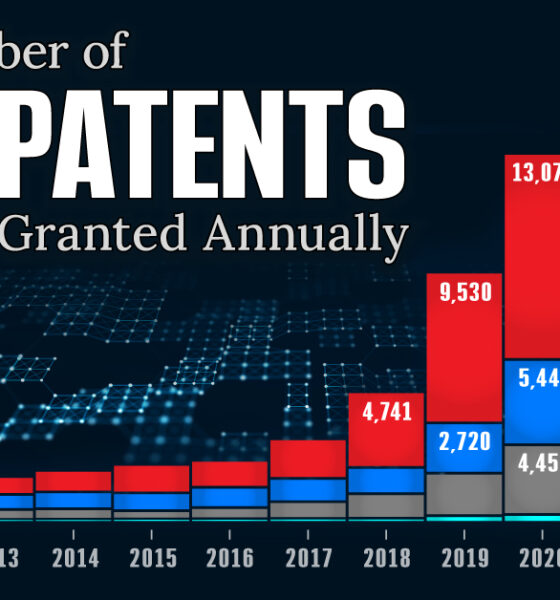
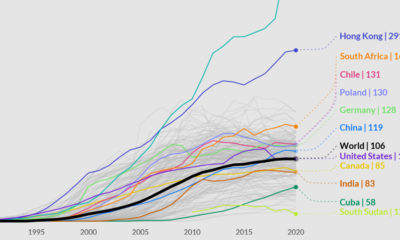
See which countries have been granted the most AI patents each year, from 2012 to 2022.


This chart looks at some of the common items that are sold on the Dark Web, and how much they sold for on average in 2022.
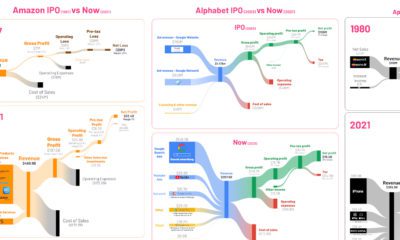

See the financials of major companies like Amazon and Tesla visualized, comparing their first year post-IPO with the most recent numbers.
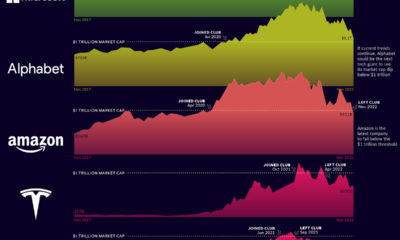

Economic woes and Fed tightening have taken their toll on the world's most valuable companies. Here's who is still part of the $1T club, and who's...

This chart shows the growth of mobile device subscriptions since 1990, around the world and in select countries.
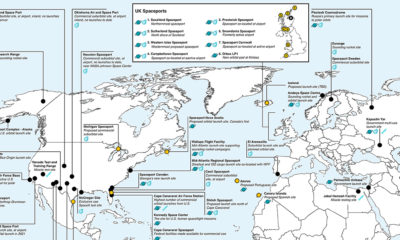

This map is a comprehensive look at both existing and proposed spaceports and missile launching locations around the world.
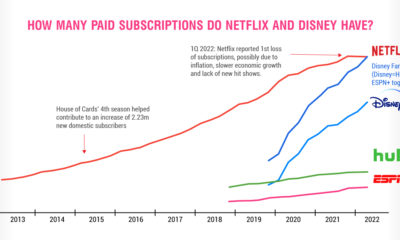

Netflix is a pioneer in video streaming, but Disney's empire is gaining subscribers fast, and giving Netflix a run for its money.
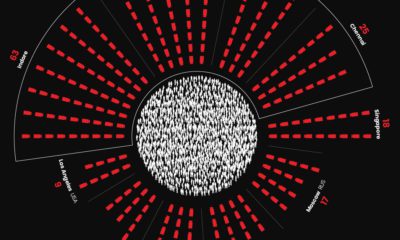

The world's most surveilled cities contain hundreds of thousands of cameras. View this infographic to see the data in perspective.
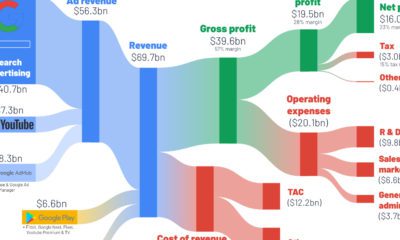

How do the big tech giants make their money? This series of graphics shows a breakdown of big tech revenue, using Q2 2022 income statements.
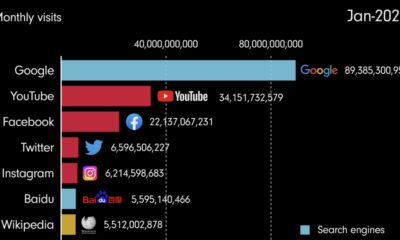

This video shows the evolution of the internet, highlighting the most popular websites from 1993 until 2022.
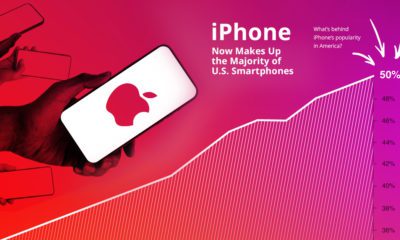

Apple's flagship device has captured a modest 16% of the global market, and Android dominates globally. Why do so many Americans keep buying iPhones?


 Creator Program