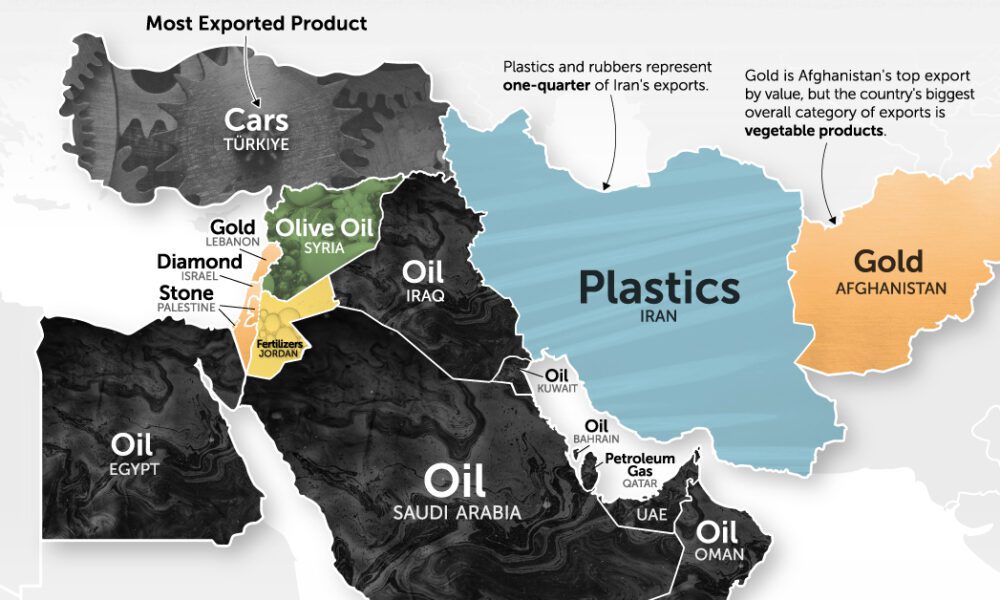
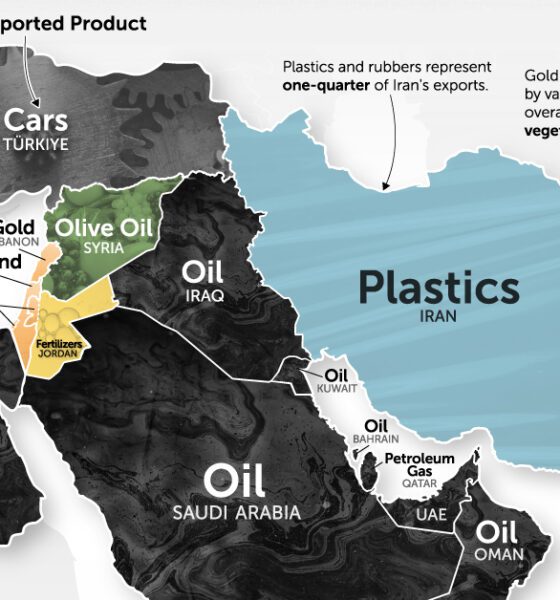
It's more than just oil. This map of Middle East exports shows the top global product of each country by...
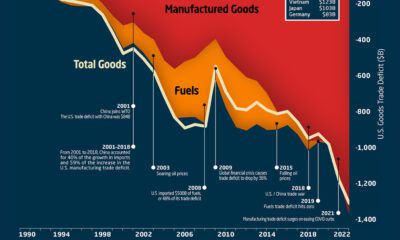

This graphic the U.S. trade deficit growth since 1990, and how manufactured goods and fuels factor in over the last three decades.
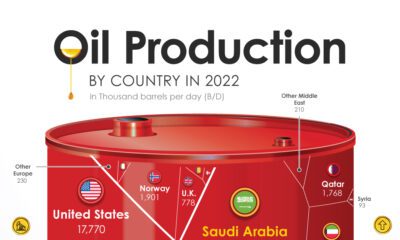

Just three countries—the U.S., Saudi Arabia and Russia—make up the lion’s share of global oil supply. Here are the biggest oil producers in 2022.
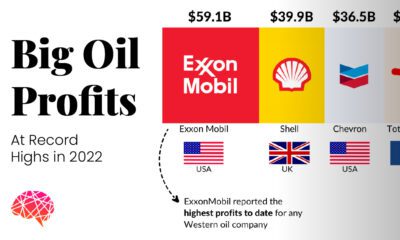

This visual highlights the five big oil companies that doubled their individual profits and earned a cumulative profit of over $200 billion in 2022.
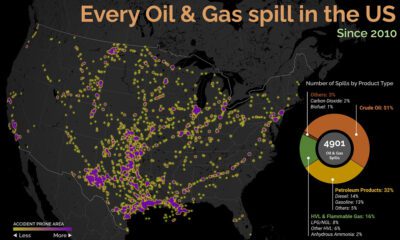

Oil and gas spills can be messy, but where are they most likely to occur? This graphic looks at oil and gas spills in the U.S....

Despite the advent of renewable sources of energy, fossil fuels and their carbon emissions, haven’t gone anywhere.


Using our database of 500+ predictions from reports, articles, interviews, and more, we highlight what experts think will happen in 2023
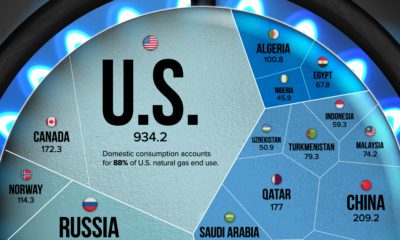

Natural gas prices have risen since Russia's invasion of Ukraine. This visualization highlights the world’s largest natural gas producers.
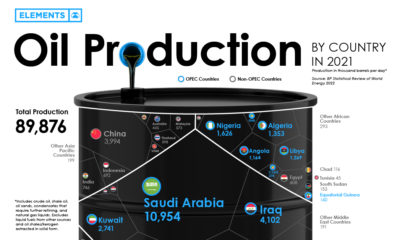

Global oil production averaged 89.8 million barrels of oil per day in 2021. Here are the world's largest oil producers.
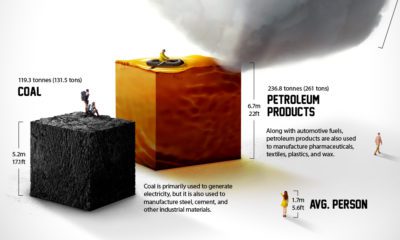

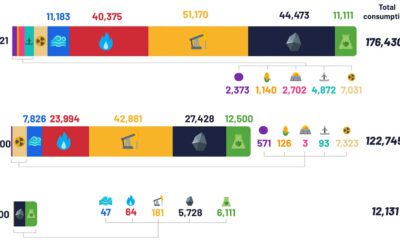
Each year the average American consumes more than 23 barrels of petroleum products. What does a lifetime of fossil fuel consumption look like?


 Creator Program