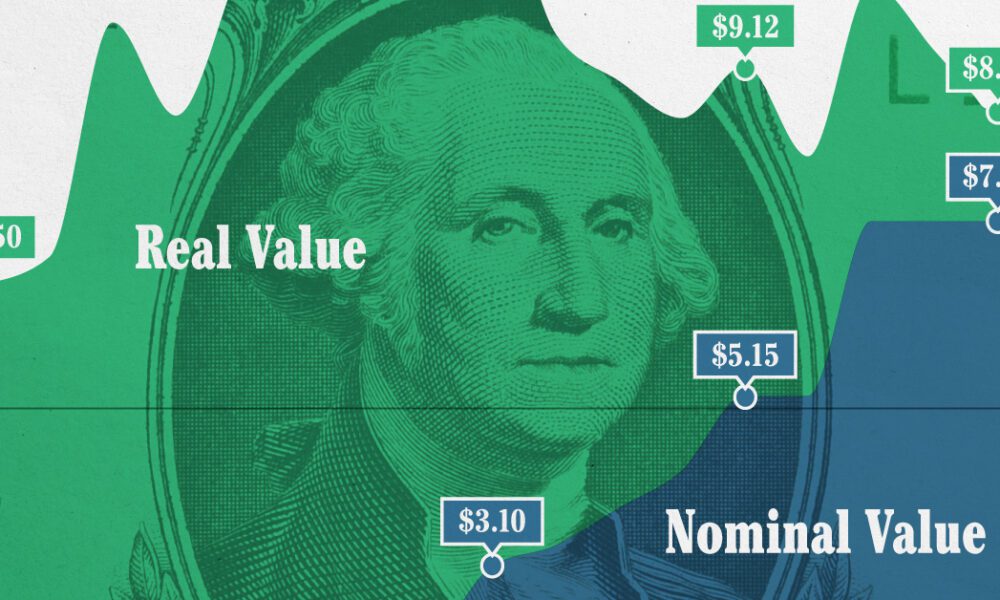
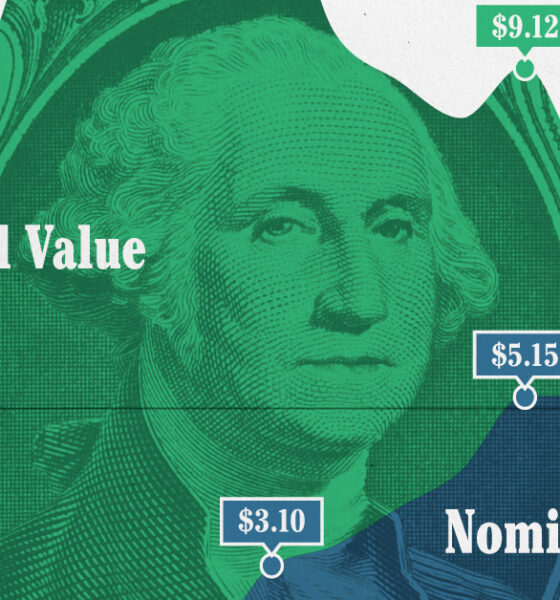
This graphic compares the nominal vs. inflation-adjusted value of the U.S. minimum wage, from 1940 to 2023.

Building wealth is not about tricks or 'get rich quick' schemes. This infographic shows the habits of millionaires that create success over the long-term.
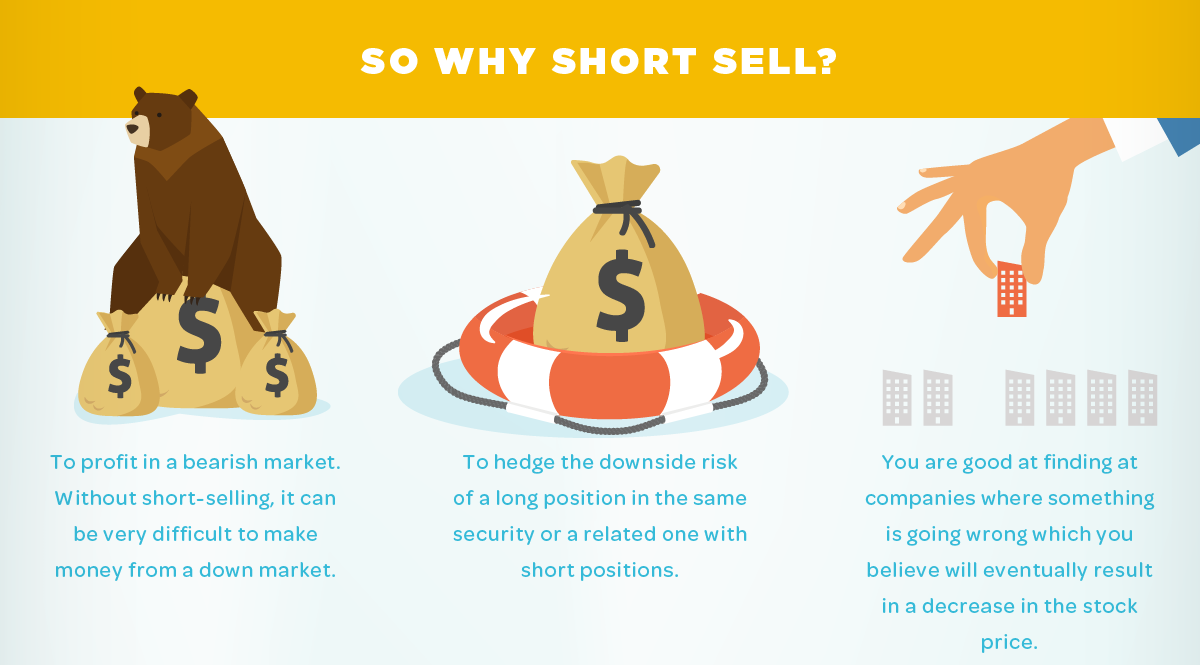
A look at the potential risks and added costs of short selling, but also an explanation where the practice may make sense for some investors.
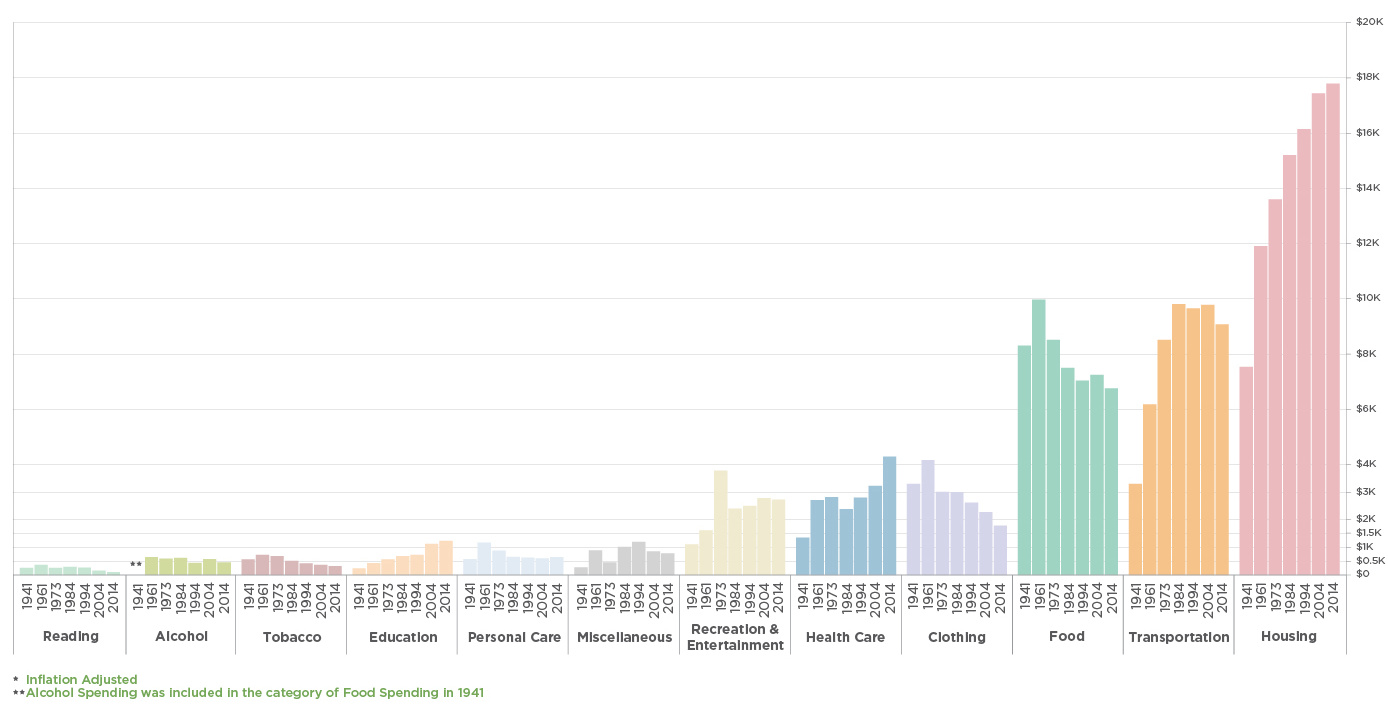
Consumers are the foundation of the economy, and how they spend money is telling. See what's changed with how Americans spend their money over the years.
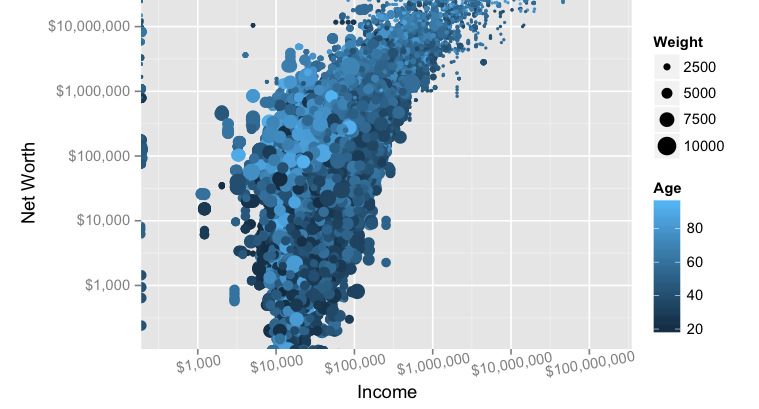
Does making a lot of money translate to actual net worth? We look at the data, and the link (or lack thereof) between income and wealth...
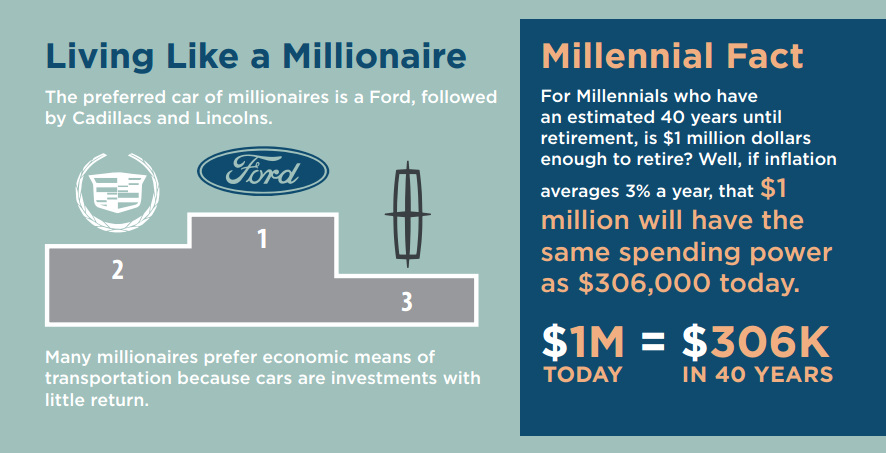
The preferred car for millionaires is a Ford, and most millionaires expect to continue working all the way until retirement.
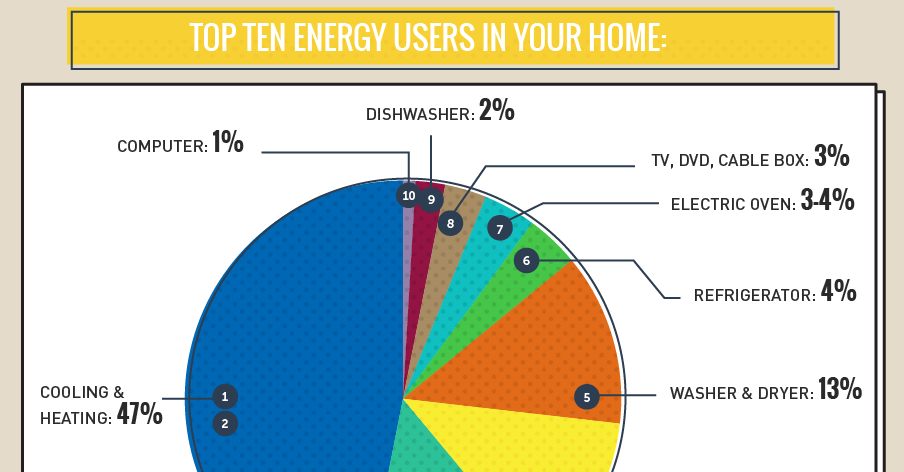
The average U.S. household spends $1,368 per year on energy, and a whopping 35% of that is wasted by appliances. See what uses the most energy...
As consumers, we're used to approaching buying decisions in a certain way. However, it turns out that process makes little sense for picking investments.
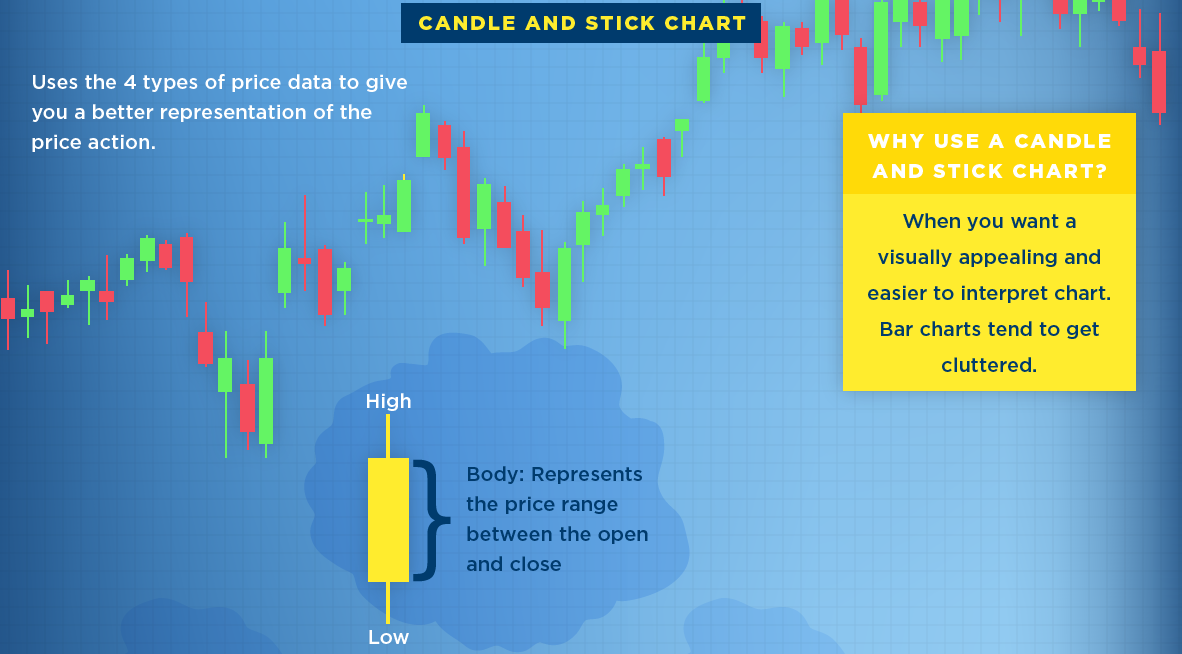
What is a stock chart? Here's three of the most common types of stock charts, along with a description of the data they typically provide investors.
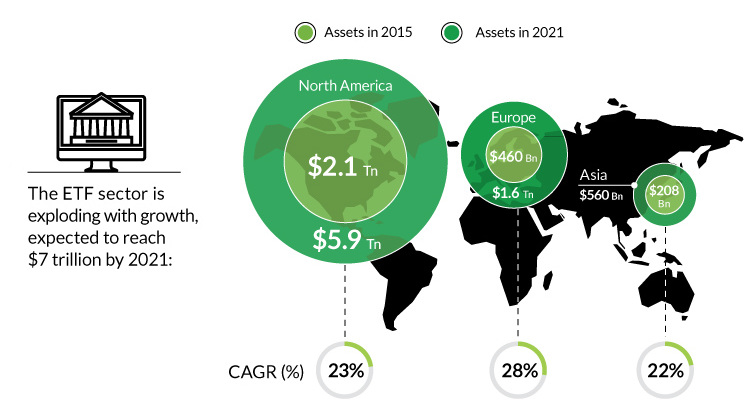
The rise of ETFs has been meteoric, and passive investing has been huge since the crisis. However, as a whole, passive has barely made a dent...
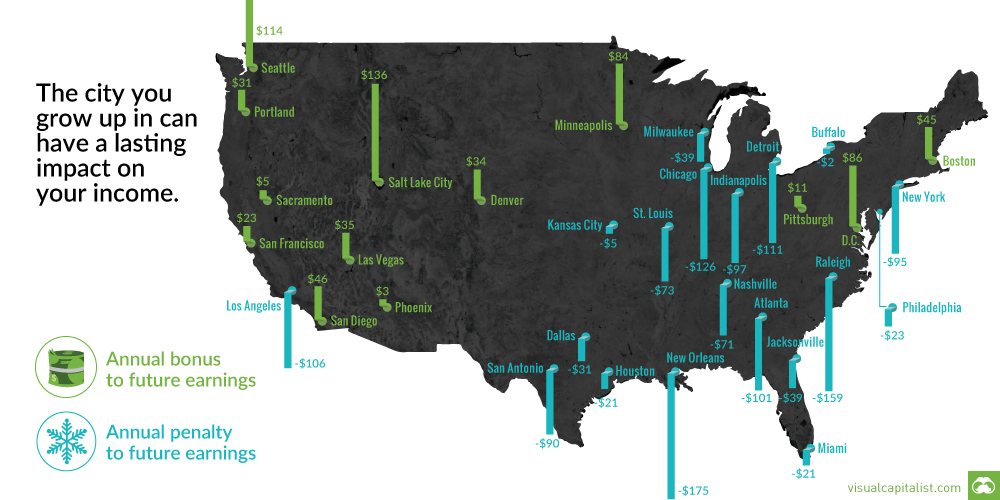
Family and neighborhoods influence a child's development and opportunities - and as a result, future incomes. See which cities have the biggest impact.


