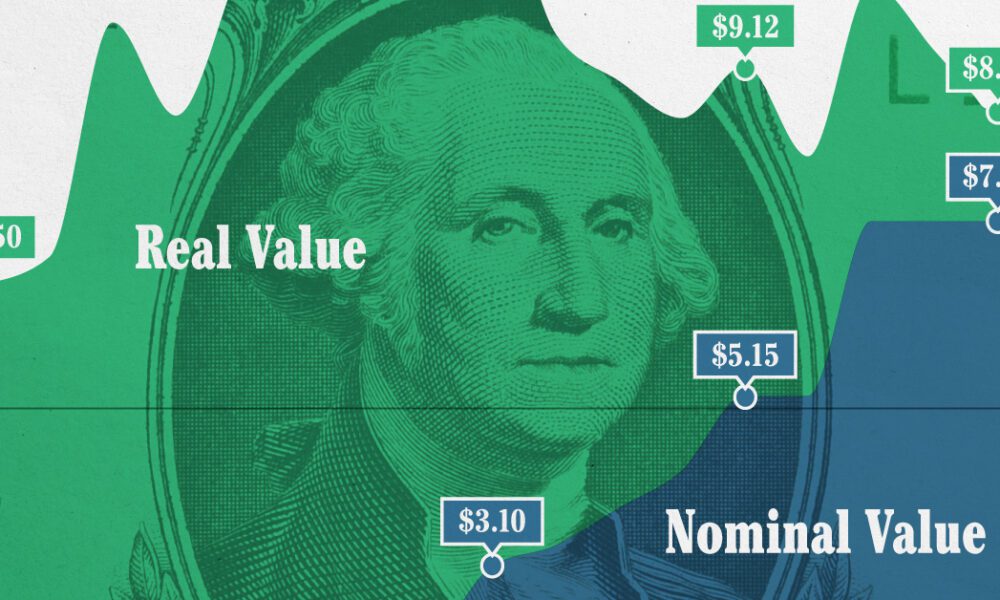
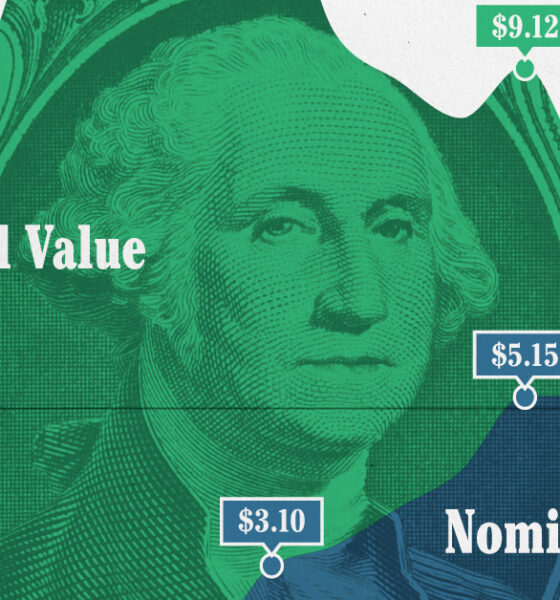
This graphic compares the nominal vs. inflation-adjusted value of the U.S. minimum wage, from 1940 to 2023.
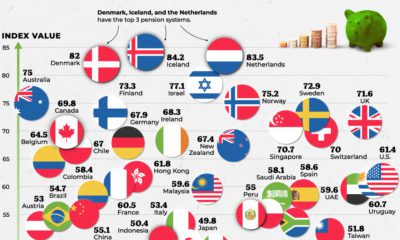

Which countries are best equipped to support their elderly citizens? This graphic compares pension plans around the world.
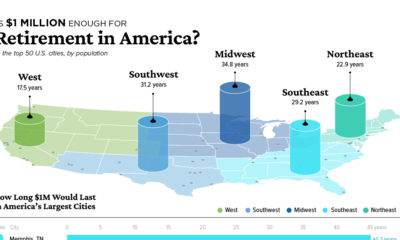

The average American needs their retirement savings to last them over a decade. In which cities is $1 million enough to retire comfortably?
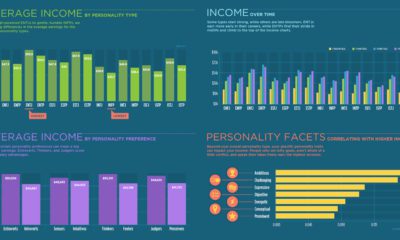

Can your Myers–Briggs personality type impact how much you make? See for yourself with this breakdown of average income for all 16 personality types.
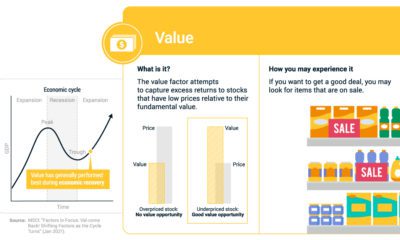

If you've bought an item on sale, you've experienced the value factor. We break down factor investing using real life examples.
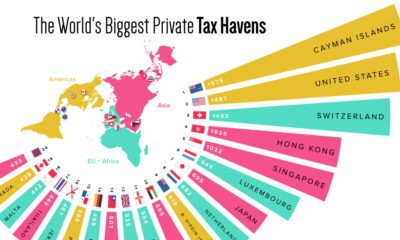

What countries or territories do the ultra-wealthy use as tax havens?
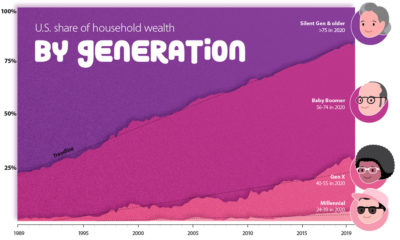

How large is the wealth gap between Millennials, Gen X, and Baby Boomers? We visualize the growing wealth disparity by generation and age.
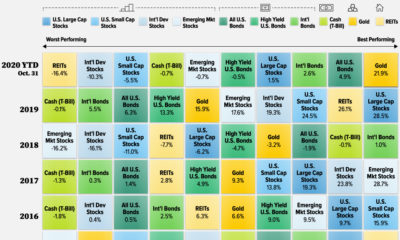

What are the best-performing investments in 2020, and how do previous years compare? This graphic shows historical returns by asset class.
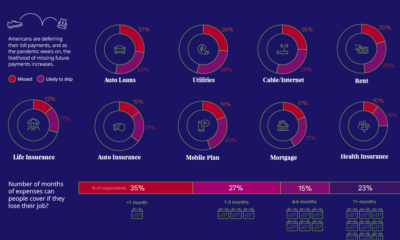

57% of U.S. consumers' incomes have taken a hit during the pandemic. How do such financial anxieties affect the ability to pay bills on time?
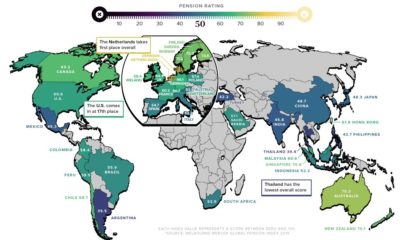

As the global population ages, pension reform is more important than ever. Here’s a breakdown of how key countries rank in terms of pension plans.
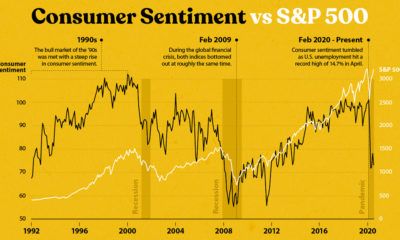

Consumer sentiment has dropped significantly since the emergence of COVID-19, but why haven't stock markets seemed to notice?


