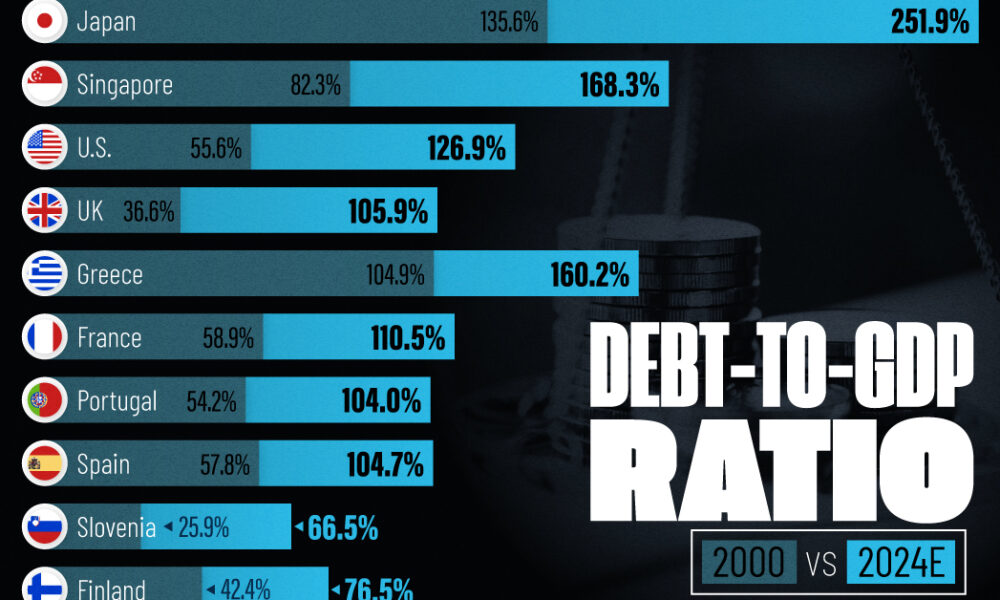
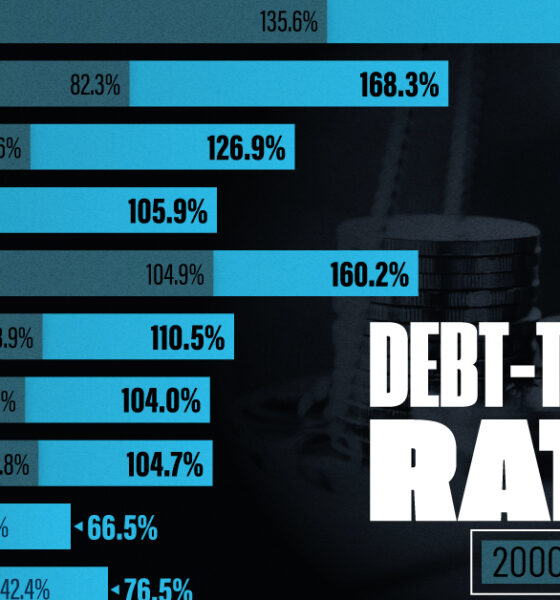
See how much the debt-to-GDP ratios of advanced economies have grown (or shrank) since the year 2000.
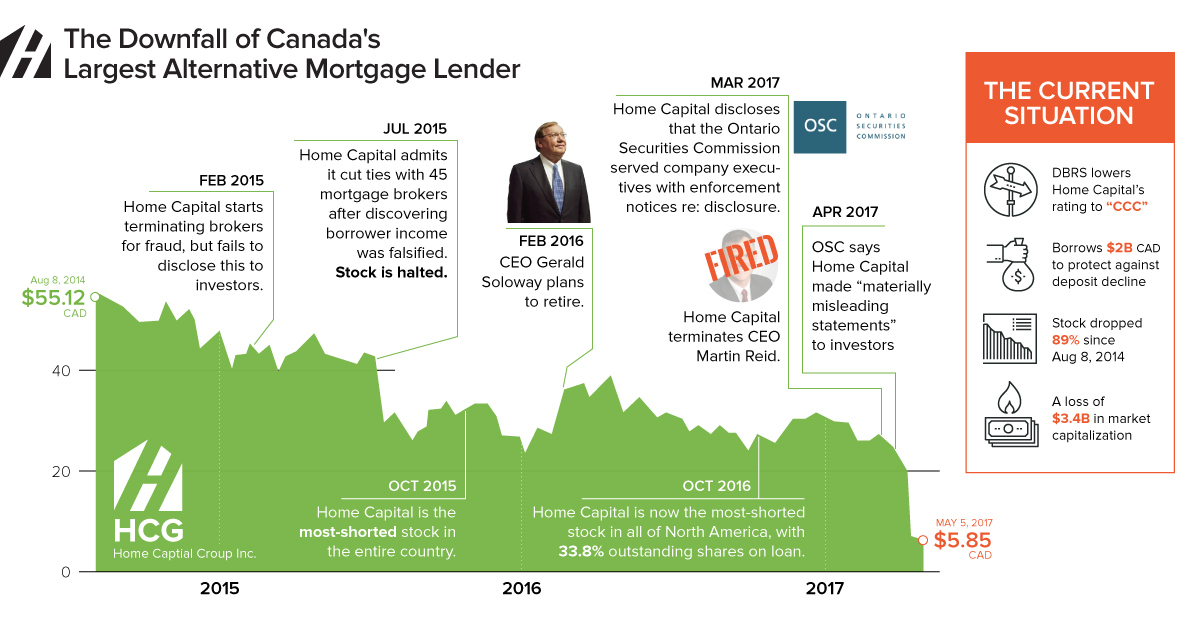
The events leading to the downfall of Home Capital, which is Canada's largest alternative mortgage lender - and what it could mean for global investors.
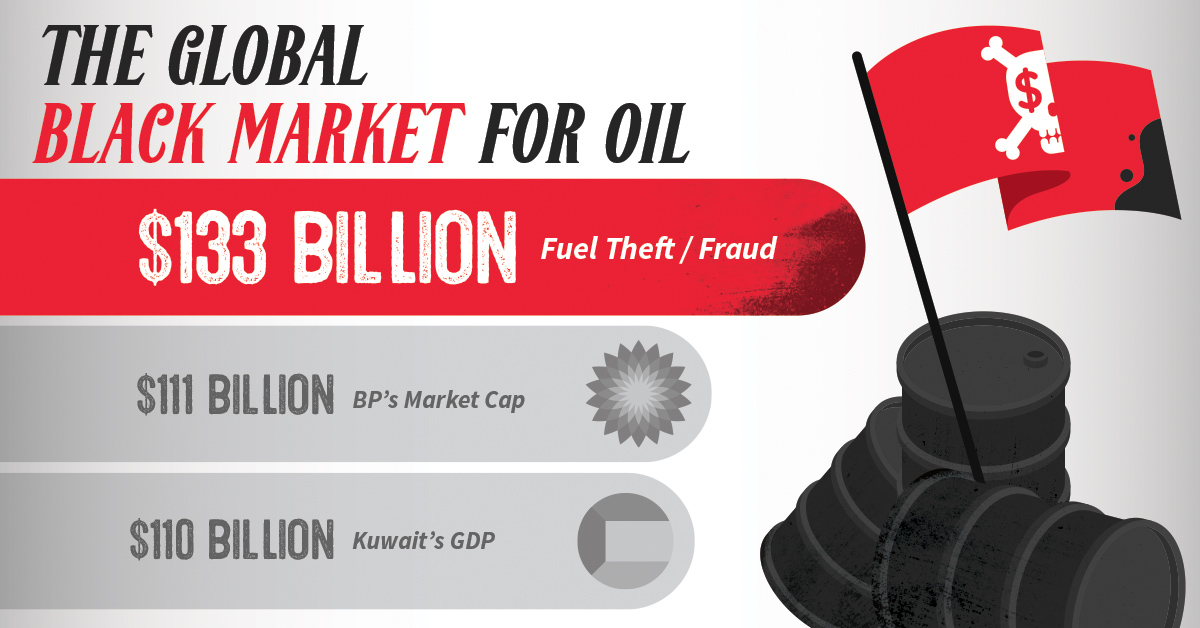
Oil is a money maker, but it's also lucrative for criminals and terrorists. Every year, $133B is lost to fuel theft - here's how it happens...
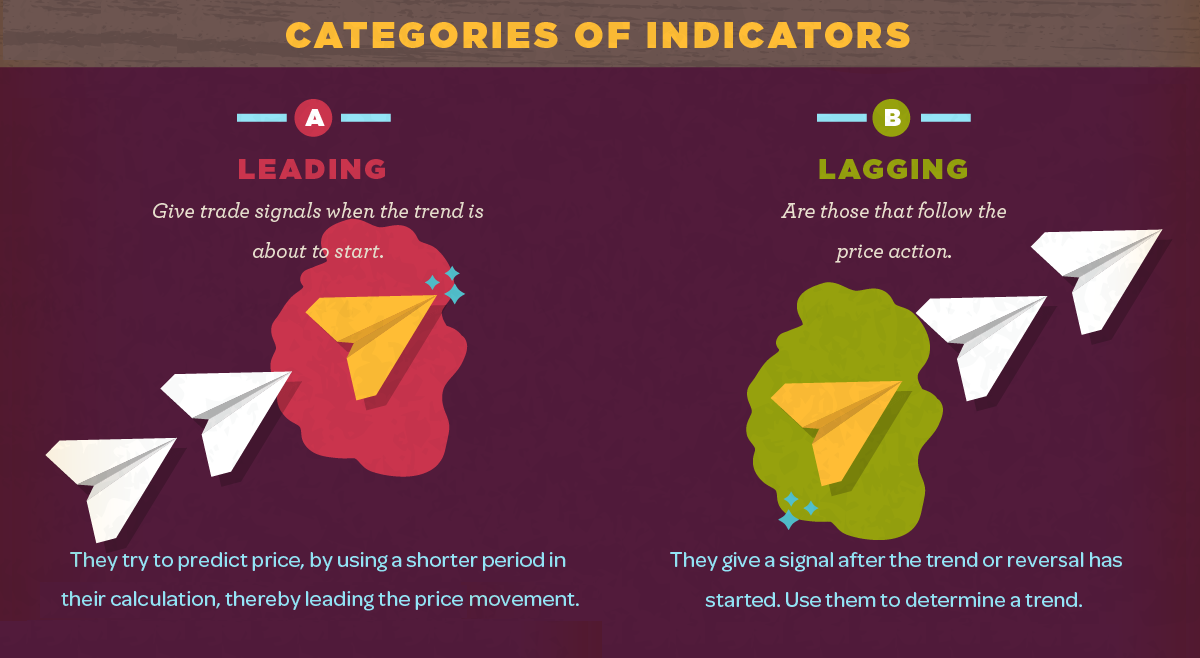
Many professional stock traders use technical indicators to help them with trade timing or to alert them of new trends. Here's what they are all about.
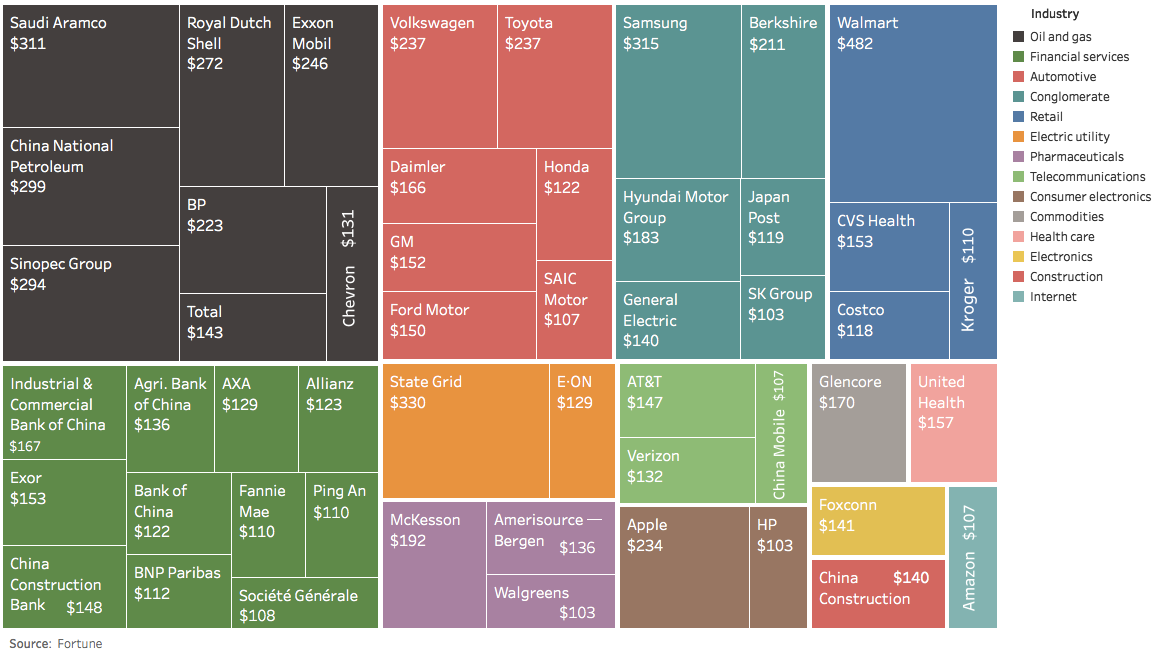
The usual oil companies and banks dominate the list of the largest 50 companies by revenue - but there are also some lesser knowns worth learning...
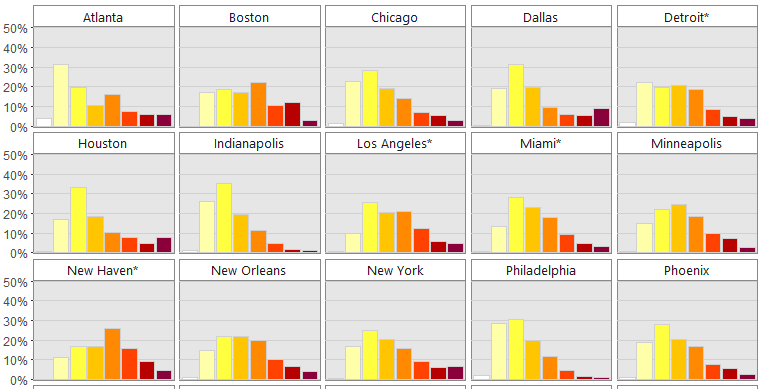
The middle class now makes up less than half of the population in the U.S. - see its decline simultaneously across 20 major cities in this...
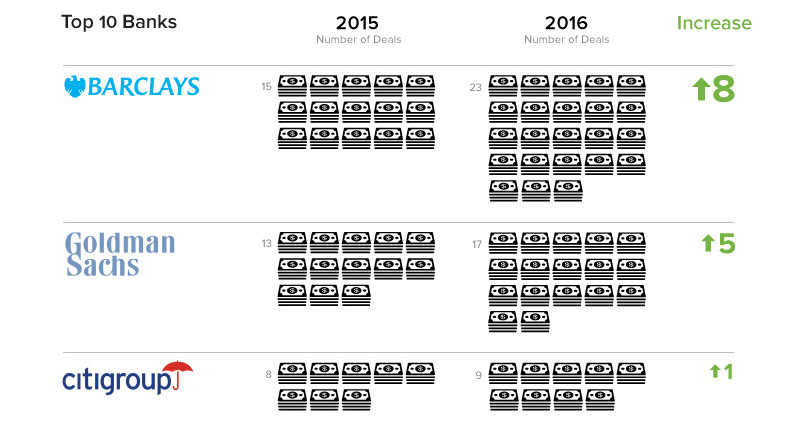
Fintech investment fell in 2016 for the first time. On the bright side? Banks are becoming much more active in the space, putting money in 61%...
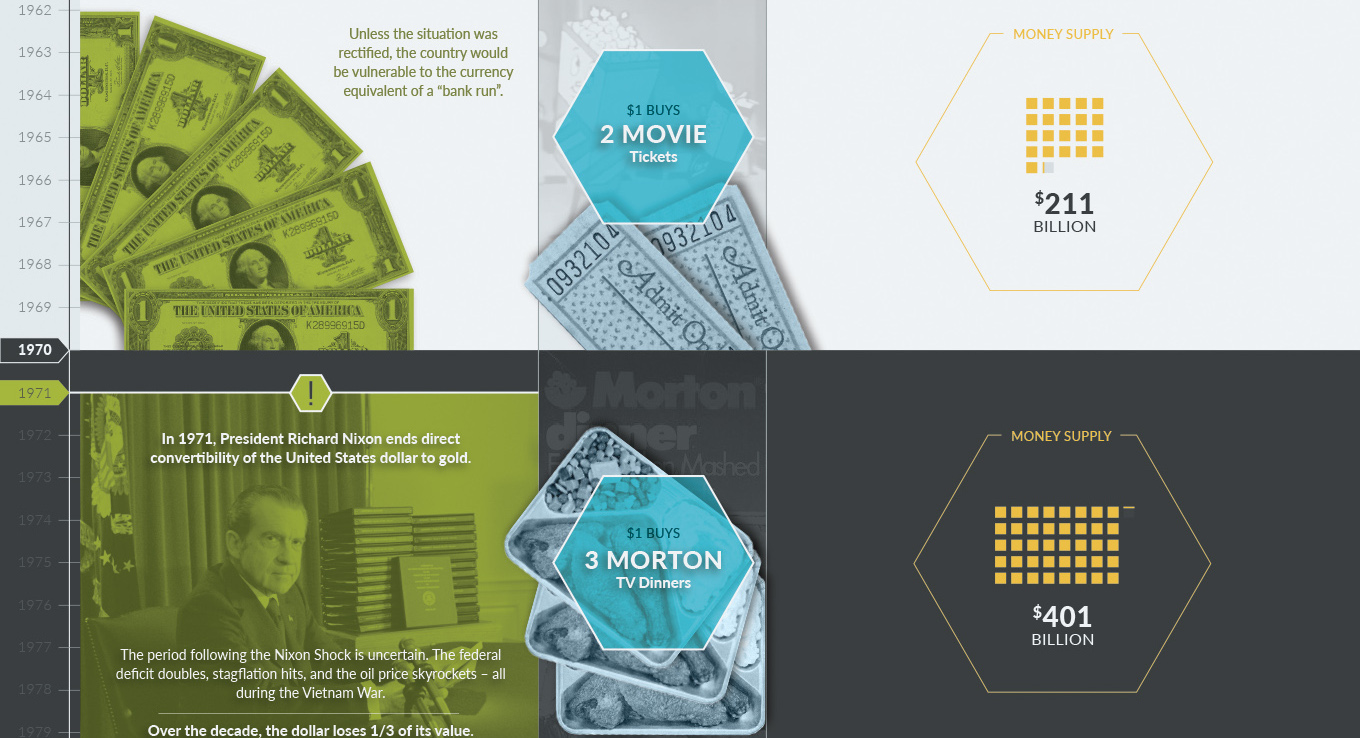
A timeline of U.S. monetary history shows the major events, the changing money supply, and the falling buying power of the U.S. dollar over time.
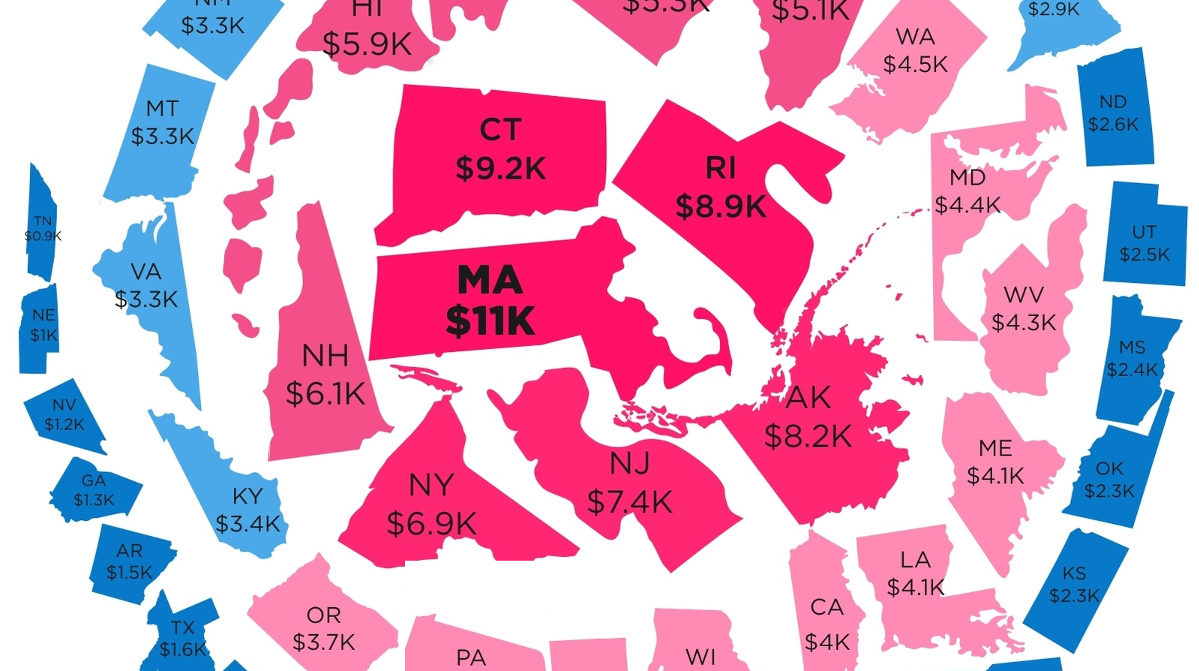
In addition to federal debt, states and municipalities also incur debt on your behalf. Here are the states with the most and least state debt per...
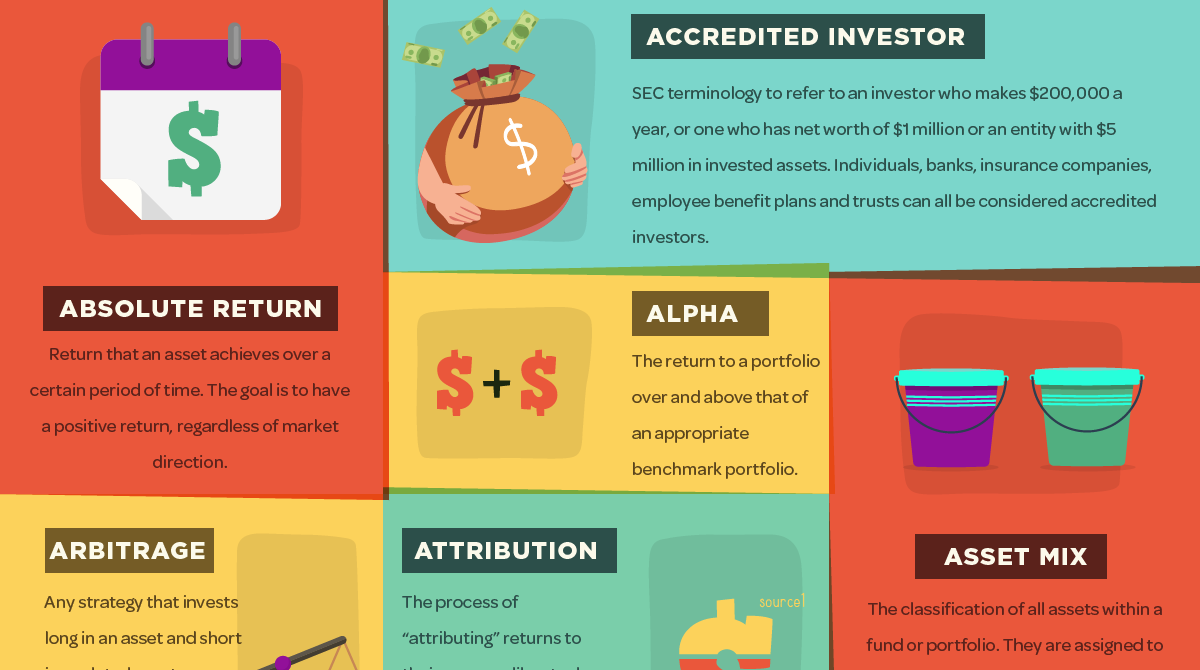
Hedge funds may seem secretive and mysterious at first, but this infographic helps to make them more understandable. Here's 48 hedge fund terms you should know.

Building wealth is not about tricks or 'get rich quick' schemes. This infographic shows the habits of millionaires that create success over the long-term.


