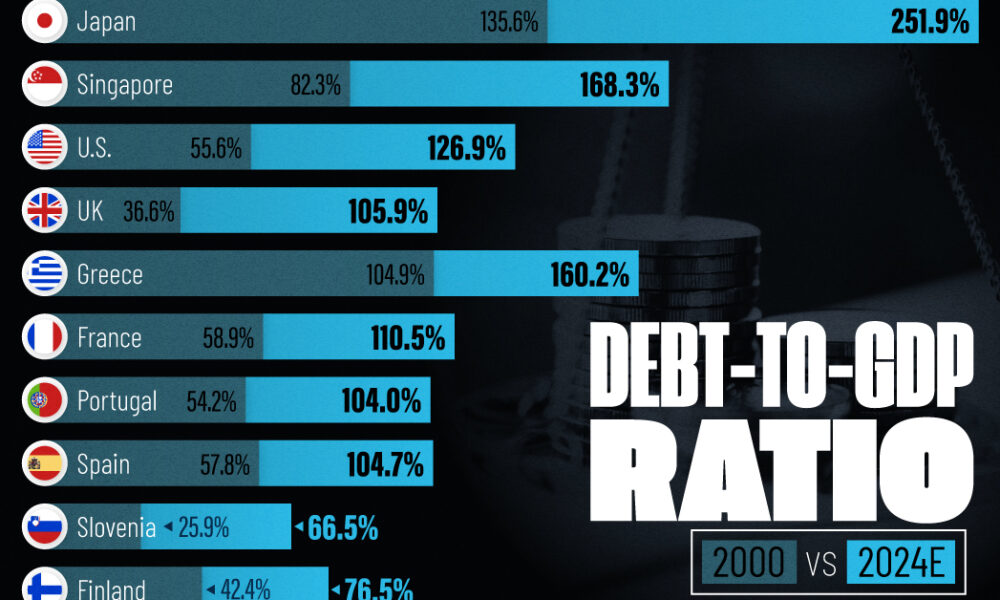
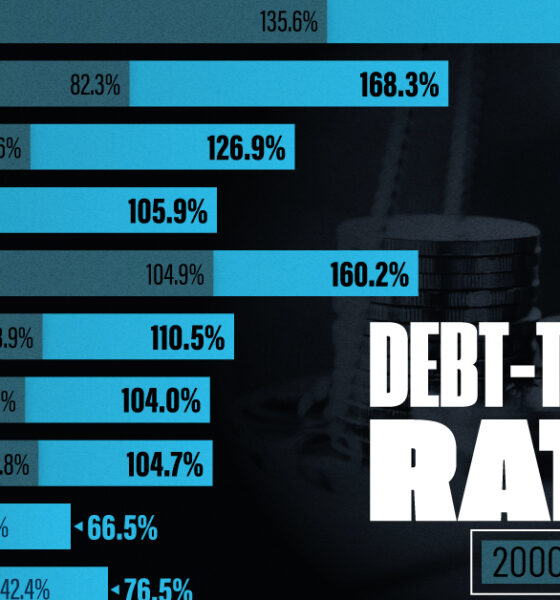
See how much the debt-to-GDP ratios of advanced economies have grown (or shrank) since the year 2000.
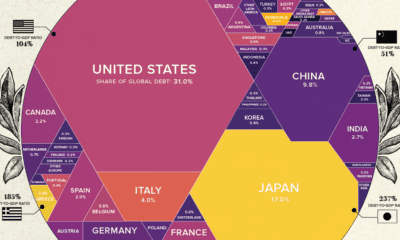

What share of government world debt does each country owe? See it all broken down in this stunning visualization.
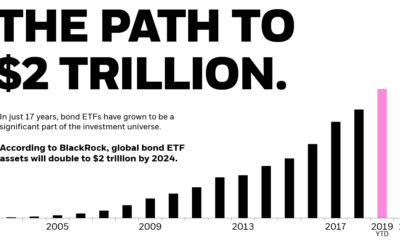

Bonds are a staple in every portfolio, but up until recently were hard to own. Here's how bond ETFs changed that, reaching $1 trillion in global...
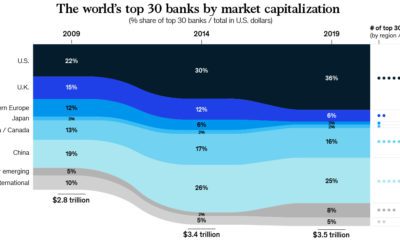

Last year, the global banking industry cashed in an impressive $1.36 trillion in profits. Here's where they made their money, and how it breaks down.
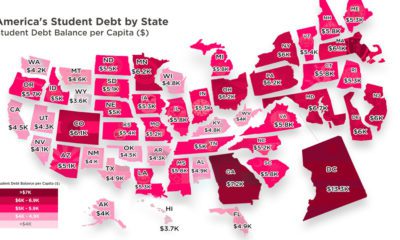

Crippling student debt in the U.S. has reached a record high of $1.5 trillion nationwide. Today’s map breaks down which states bear the highest burden.


See how consumer credit has evolved through the ages — from its ancient origins, to the use of game-changing technologies like artificial intelligence.
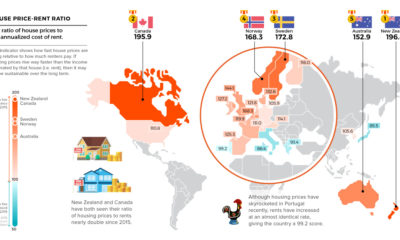

Which real estate markets have the highest risk of seeing a correction? These maps highlight housing bubble risks using data from four key indicators.


We all have a stereotypical image of the average consumer - but is it an accurate one? Meet the modern consumer, and what it means for...
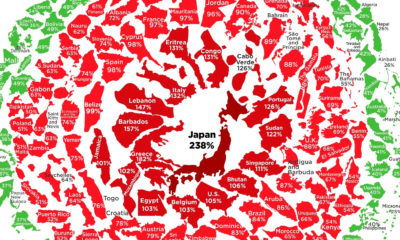

See the latest levels of government debt, based on the IMF's most recent data. Where does your country sit in the snowball?

Massive amounts of data, the use of biometrics, the fintech boom, and neural networks are just some trends shaping the future of consumer credit.
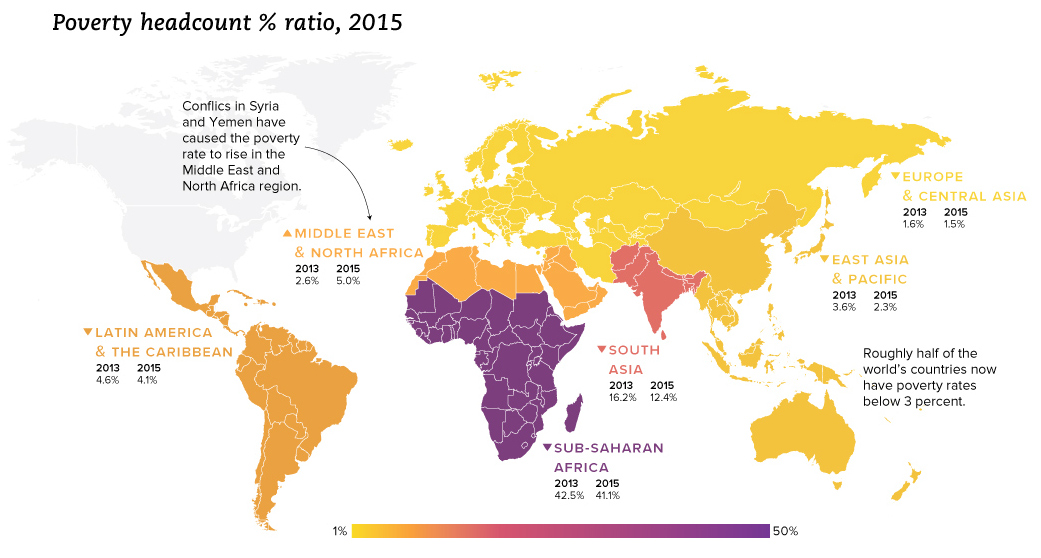
We look at the latest data from the World Bank, which reveals a drop in extreme poverty of 1 billion people globally since the year 1990.