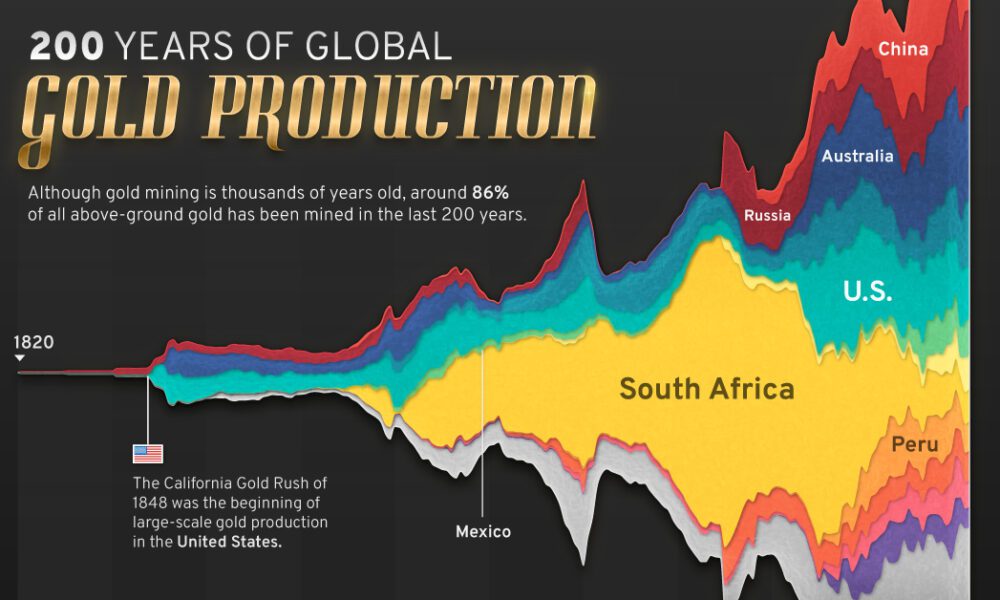
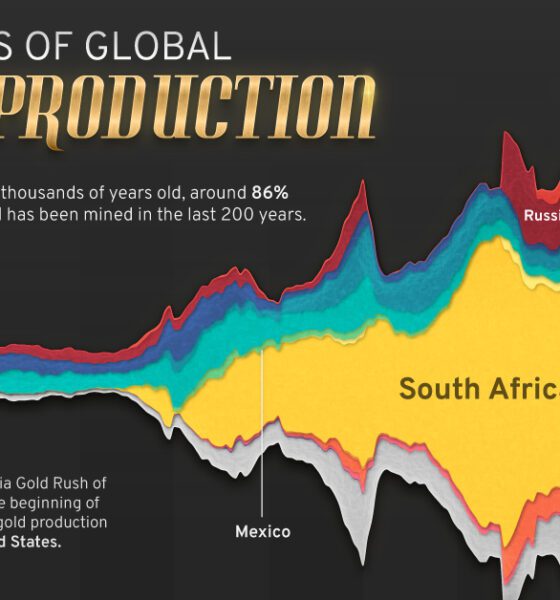
Global gold production has grown exponentially since the 1800s, with 86% of all above-ground gold mined in the last 200...
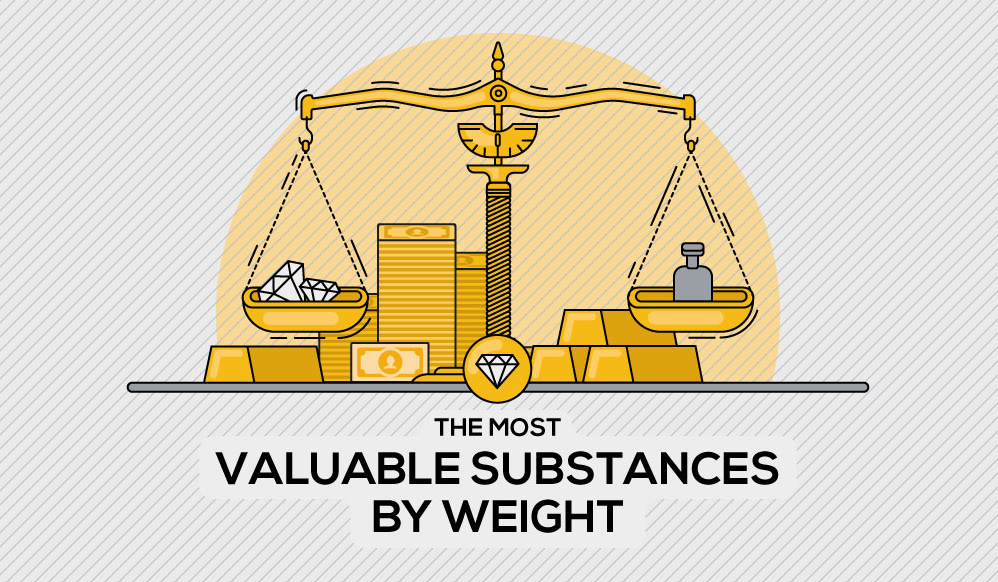
What are the world's most valuable substances? This infographic looks at everything ranging from Iranian beluga caviar to rare metals and gemstones to find out.

We highlight the top points from an investment show in San Francisco on topics like wealth and currency, via Frank Holmes, Frank Trotter & Jeffrey Christian
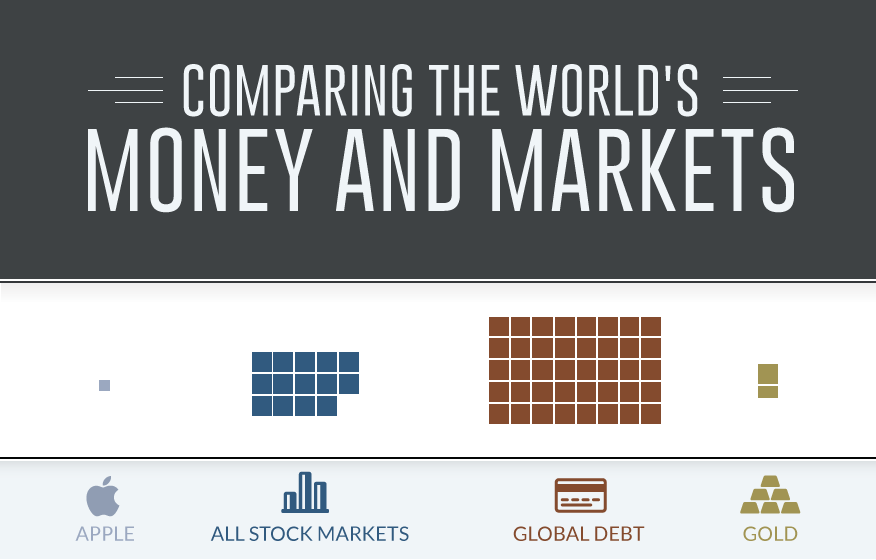
This data visualization compares the world's money supply and markets to give a sense of perspective.

The Money Project uses rich visuals such as infographics and data visualizations to explore the concept and implications of money.
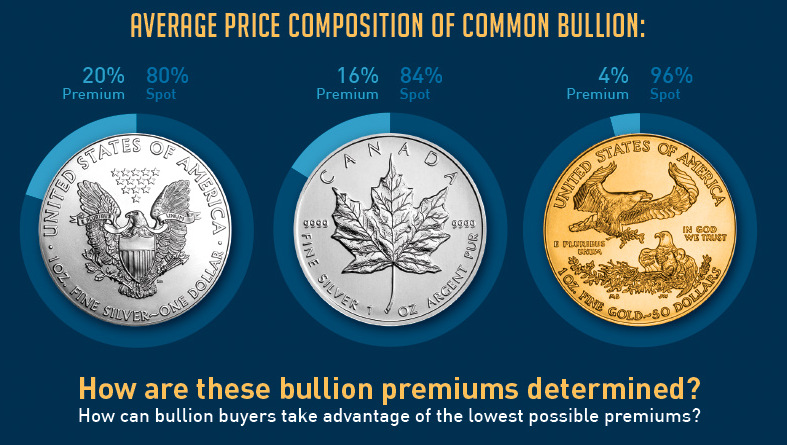
The price that investors pay for gold or silver bullion depends on two things: spot price and bullion premiums. How are the premiums calculated?
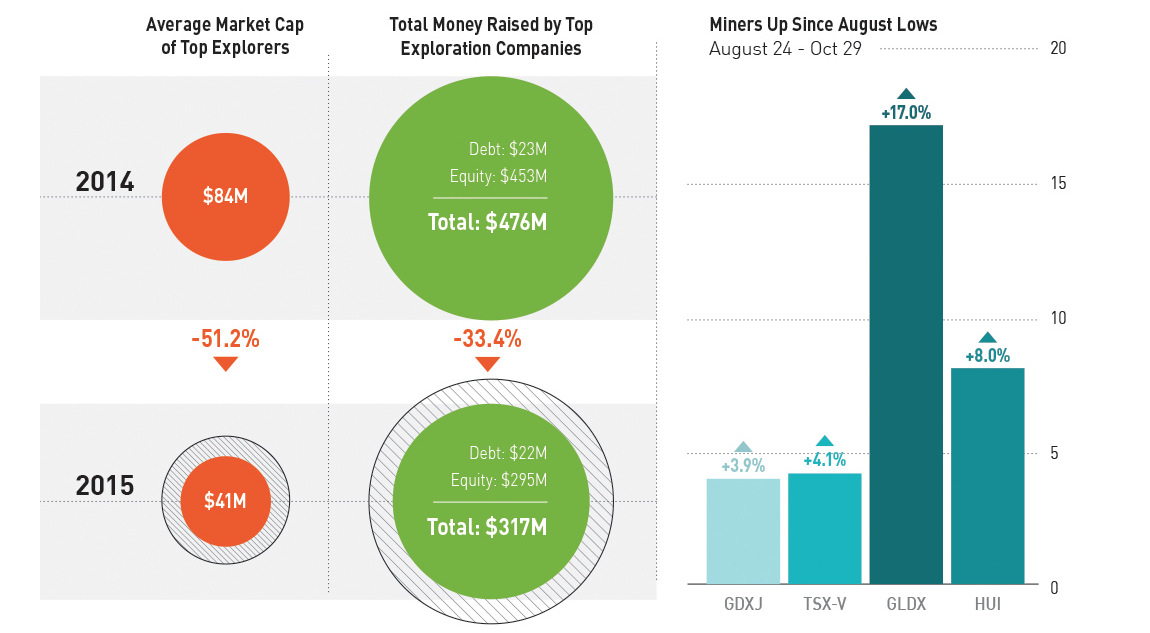
Recently, PwC published a report profiling the malaise of the Top 100 junior miners. We recap those findings, but also show why there may be signs...
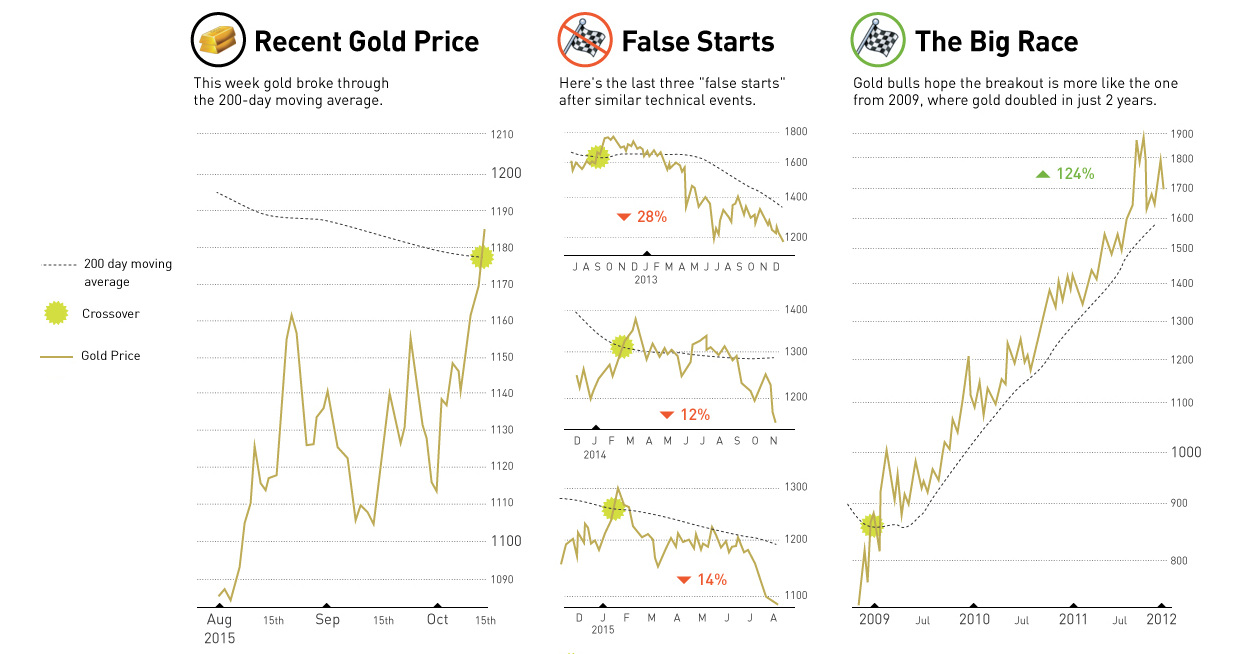
This week, gold made a technical breakthrough past its 200-day moving average. We look at past occurrences of this event, and the potential consequences.
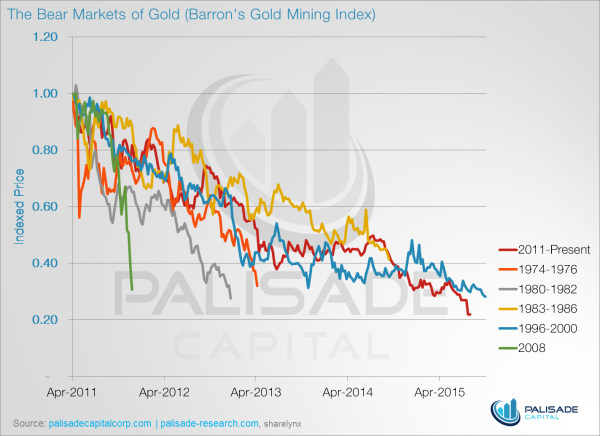
These five charts show why gold stocks have never been cheaper.

In the finale of our four part infographic series of silver, we look at the case for holding silver as an asset.

In Part 3 of the Silver Series, we cover the world's growing demand for silver. One of the most versatile metals, demand for silver stems from...


