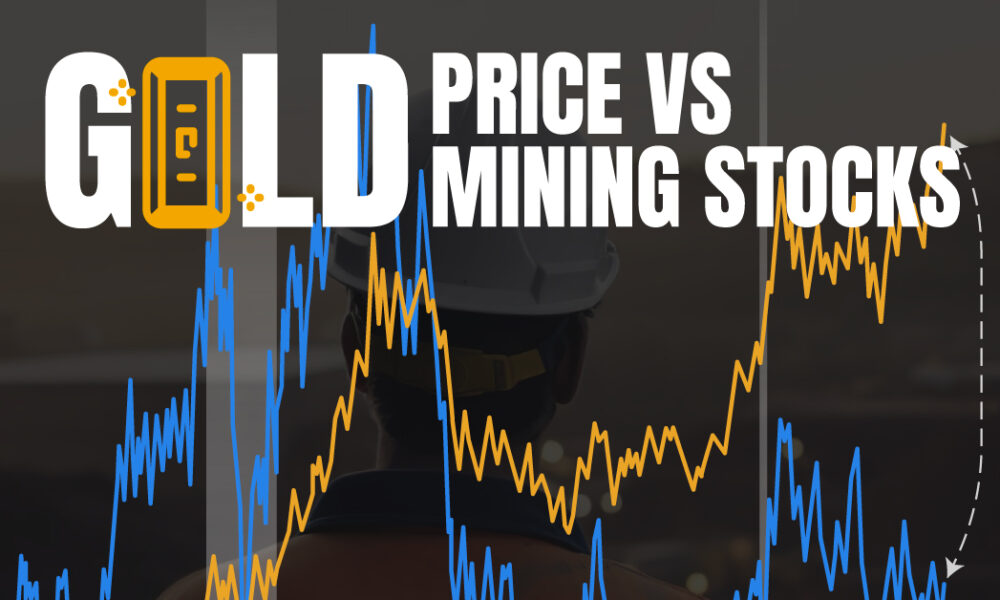

While the price of gold has reached new record highs in 2024, gold mining stocks are still far from their...
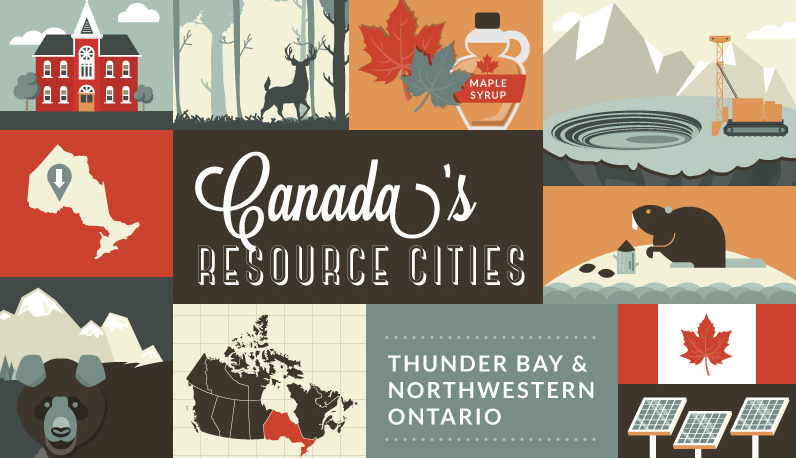
This infographic highlights interesting facts on Thunder Bay & Northwestern Ontario, one of Canada's most important hubs for natural resources.
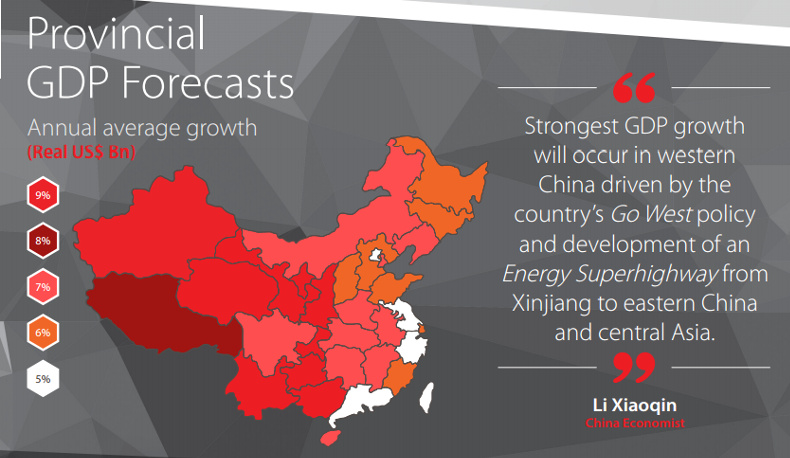
With supply remaining abundant and demand staying weak, the debate continues on when Peak Coal will occur in China. This infographic looks at growth and energy...
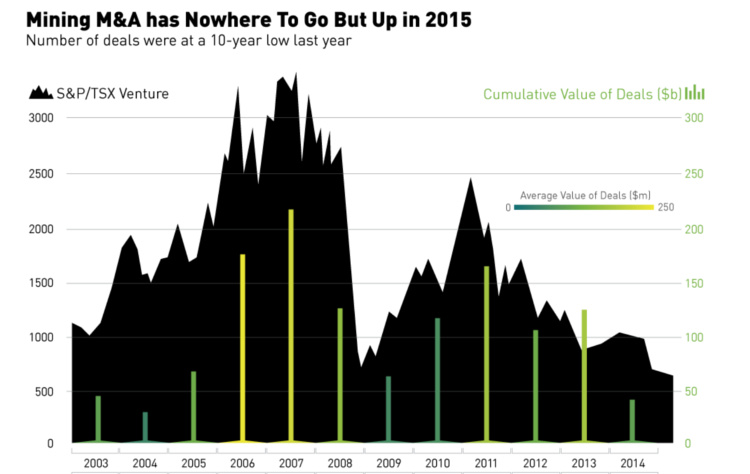

This week's chart shows the volume, average value, and cumulative value of mining M&A deals against overall market performance.
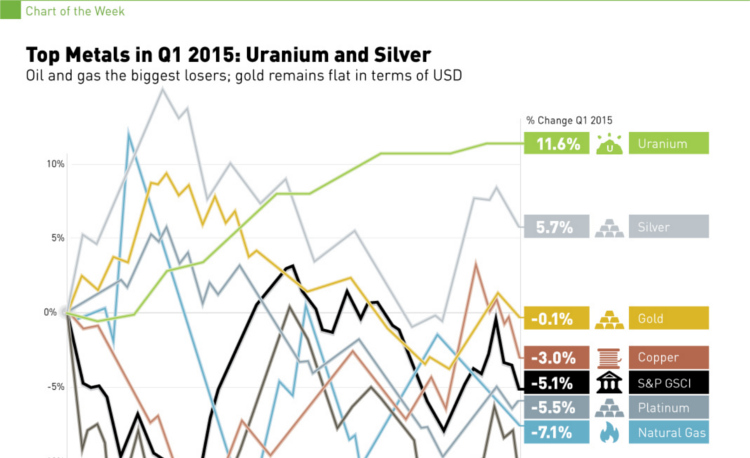
In 2015 Q1, silver and uranium led the way, while oil and natural gas struggled. See all returns in today's Chart of the Week.
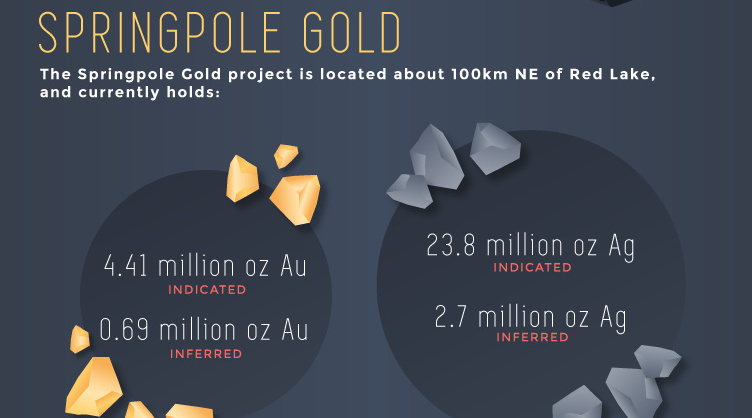
Gold Canyon Resources (TSX-V: GCU) is a Canadian company that controls a 100% interest in the Springpole Gold Project in Ontario.
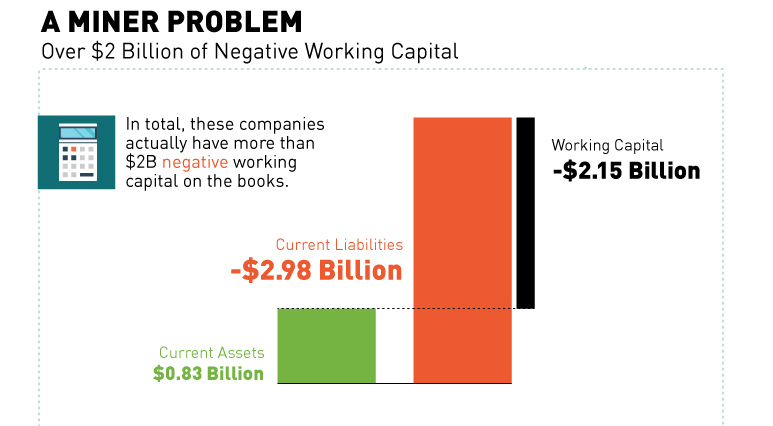
A recent report suggests that nearly 600 or 40% of listed mining companies in Canada do not meet continuous listing requirements.
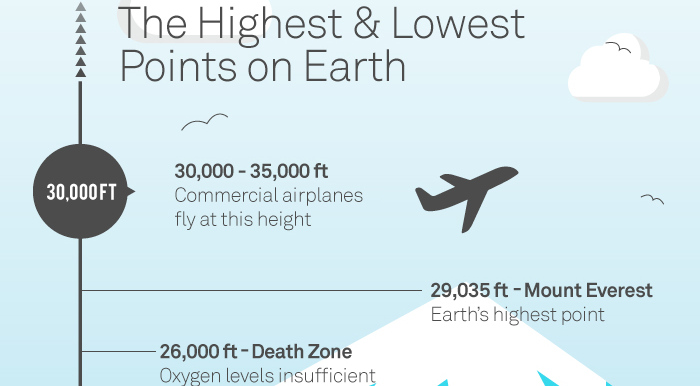
The highest and lowest places on Earth are put into perspective in this visualization. How deep are the world's deepest mines and drill holes?
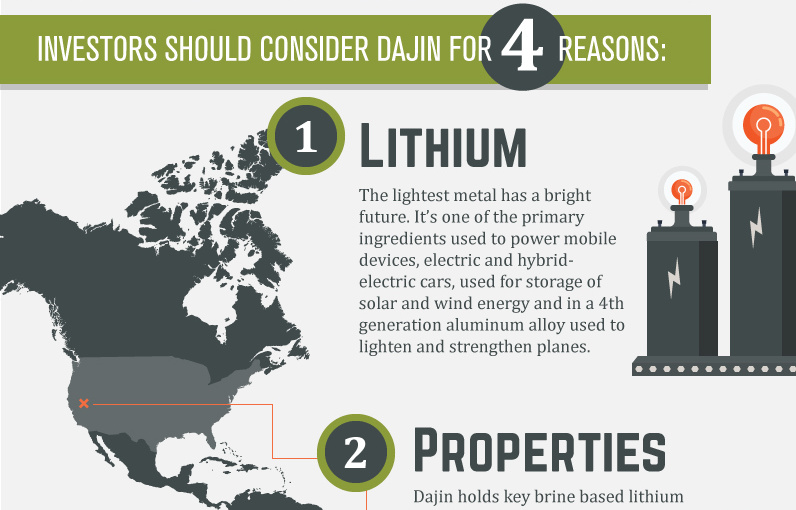

Dajin Resources Corp, an energy metals company with strategically located brine based lithium exploration projects in both South and North America.

This infographic covers everything you should know about copper porphyries, one of the most important sources of gold, copper, and molybdenum.
Red Lake is the high-grade gold capital of the world, located in Western Ontario, Canada. This infographic highlights its history and upcoming projects.