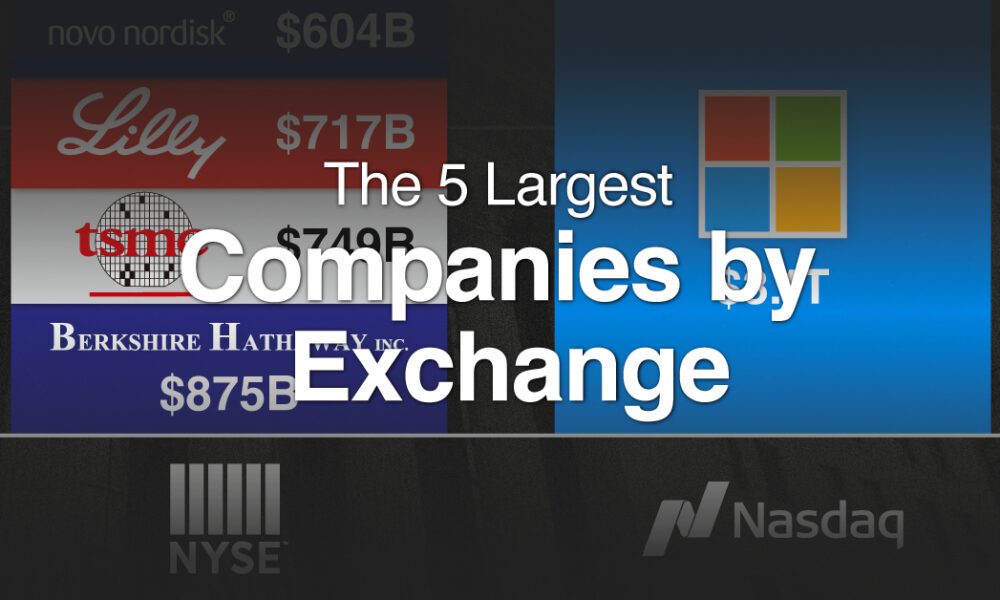
With trillion dollar valuations becoming more common, we've compared the five biggest companies by stock exchange.

In this infographic, we list the 15 most shorted stocks in the U.S. in the Fall of 2023, ranked by the value of their short interest.

FAANG is dead… meet the 'Magnificent Seven' stocks that now make up over 25% of the S&P 500.
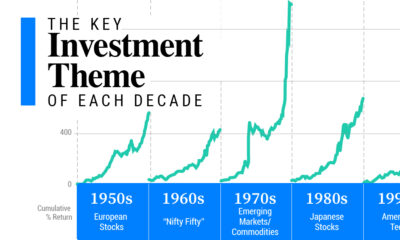

Here are the investment themes that have defined each decade from the 'Nifty Fifty' to the tech giants of the 2010s.
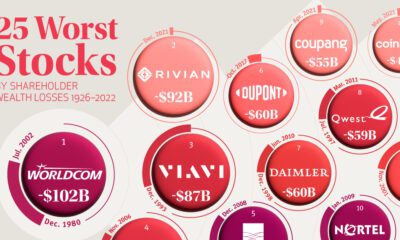

Among publicly-listed U.S. companies, the 25 worst stocks have lost shareholders a collective $1.2 trillion since 1926.
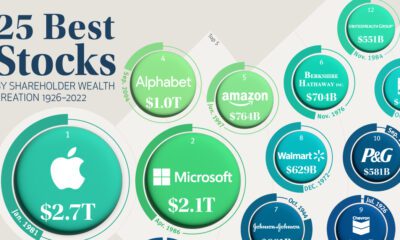

Accounting for just 0.1% of all public U.S. stocks, these companies have created nearly a third of all shareholder wealth since 1926.
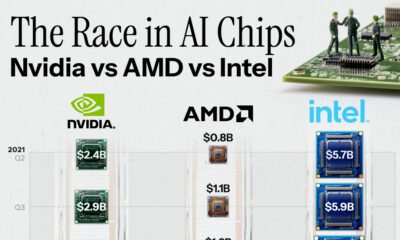

The generative AI boom is powered by processors. How have AI chip sales grown over the last two years among Nvidia vs AMD vs Intel?
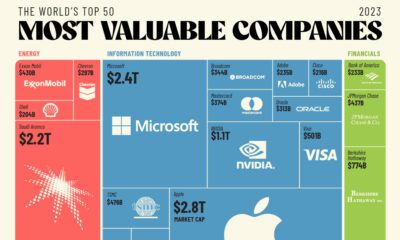

The world's 50 most valuable companies represent over $25 trillion in market cap. We break this massive figure down by company and sector.
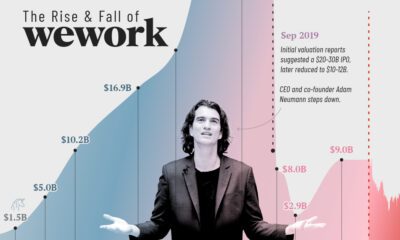

At the height of its success, WeWork was valued at $47 billion. Four years later, WeWork is worth a fraction of the total. What happened?


The highest one-year return among the top S&P 500 stocks from 1980 to 2022 was a staggering 2,620%. Which stocks top the ranks?


In this excerpt from our Markets This Month VC+ newsletter, we looked at how five portfolios of super investors shaped up at end of Q1 2023.


