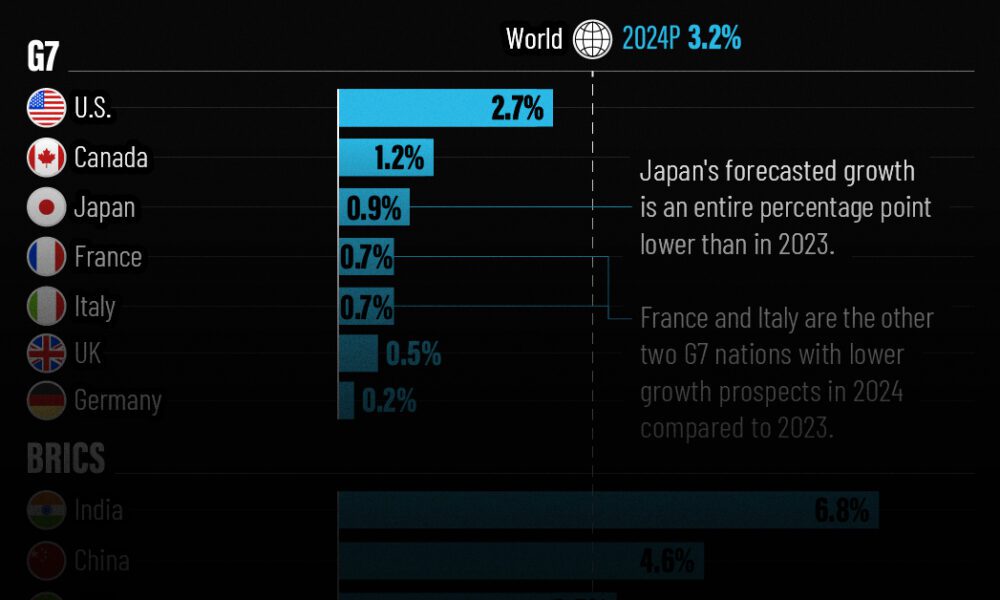
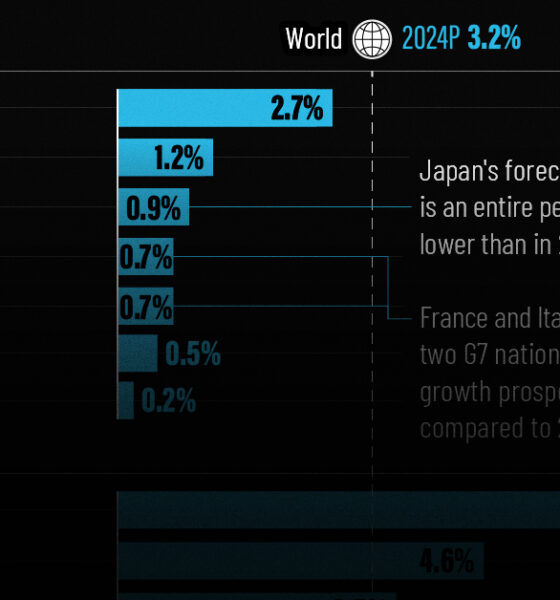
The IMF has released its economic growth forecasts for 2024. How do the G7 and BRICS countries compare?
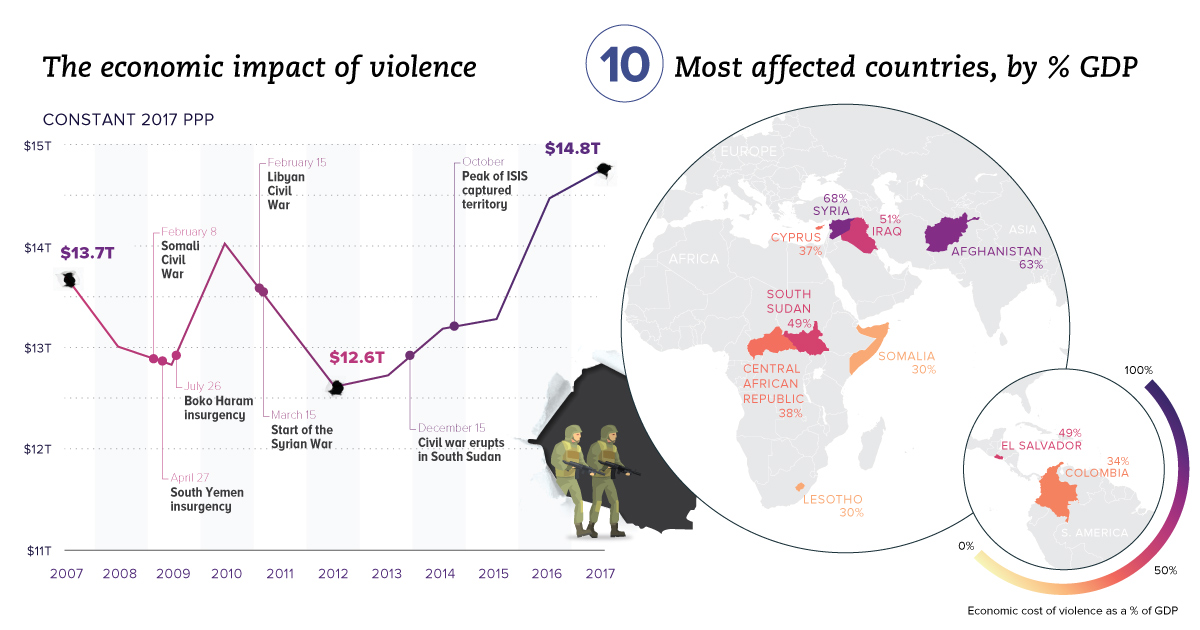
Aside from the obvious human toll, violence also hurts productivity and wealth creation. We visualize the real economic impact of violence in these charts.
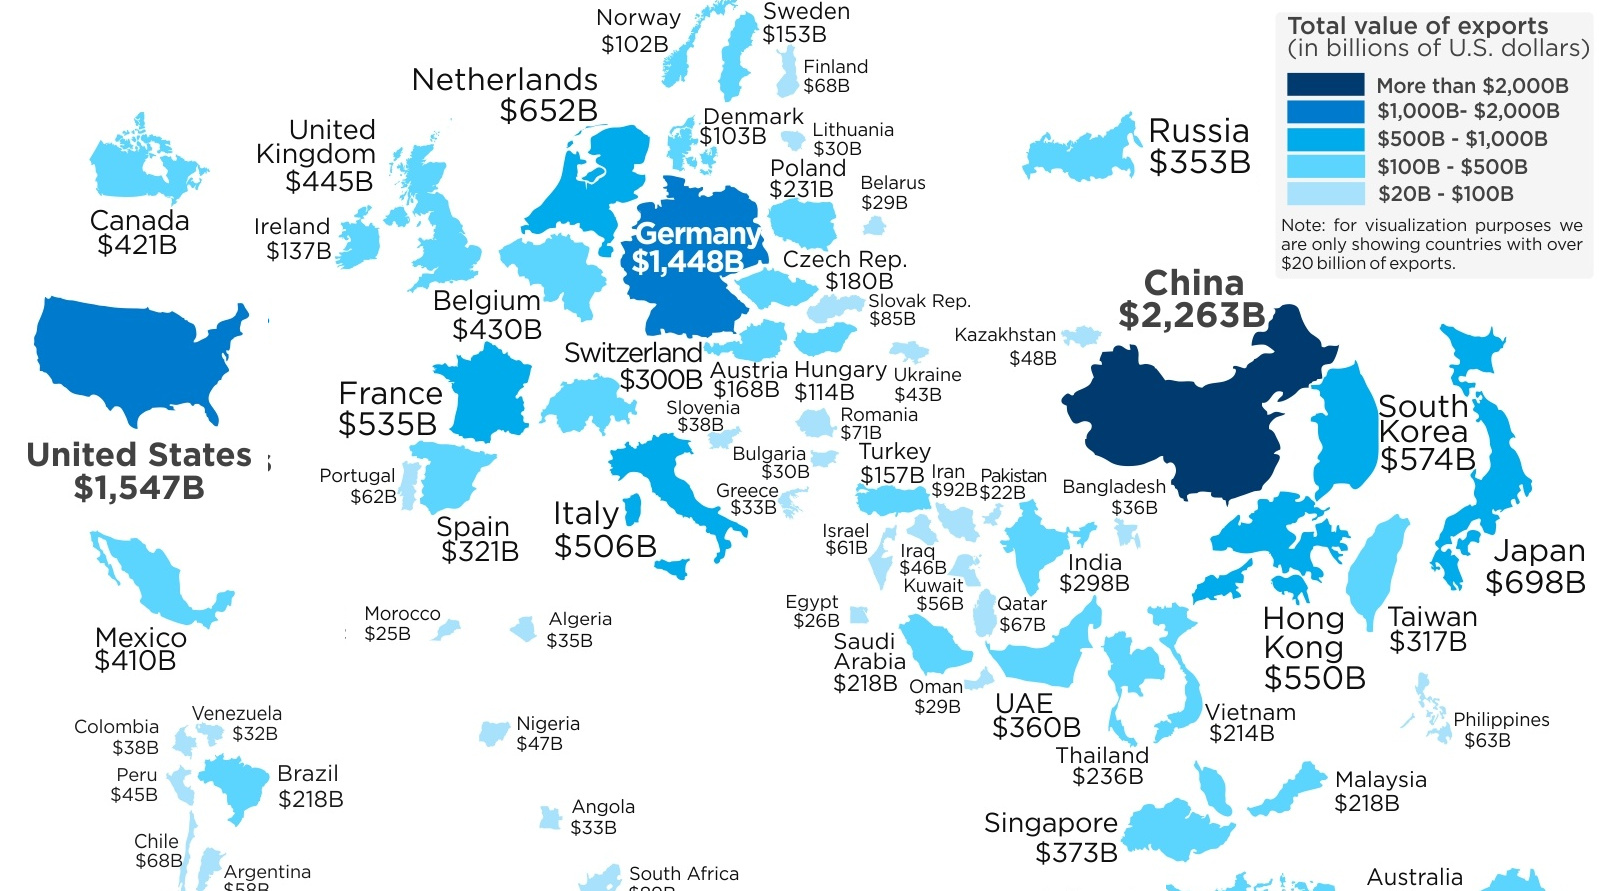
This map re-sizes countries based on the amount of goods they export abroad, giving a clear look at the world's biggest exporters of 2017.
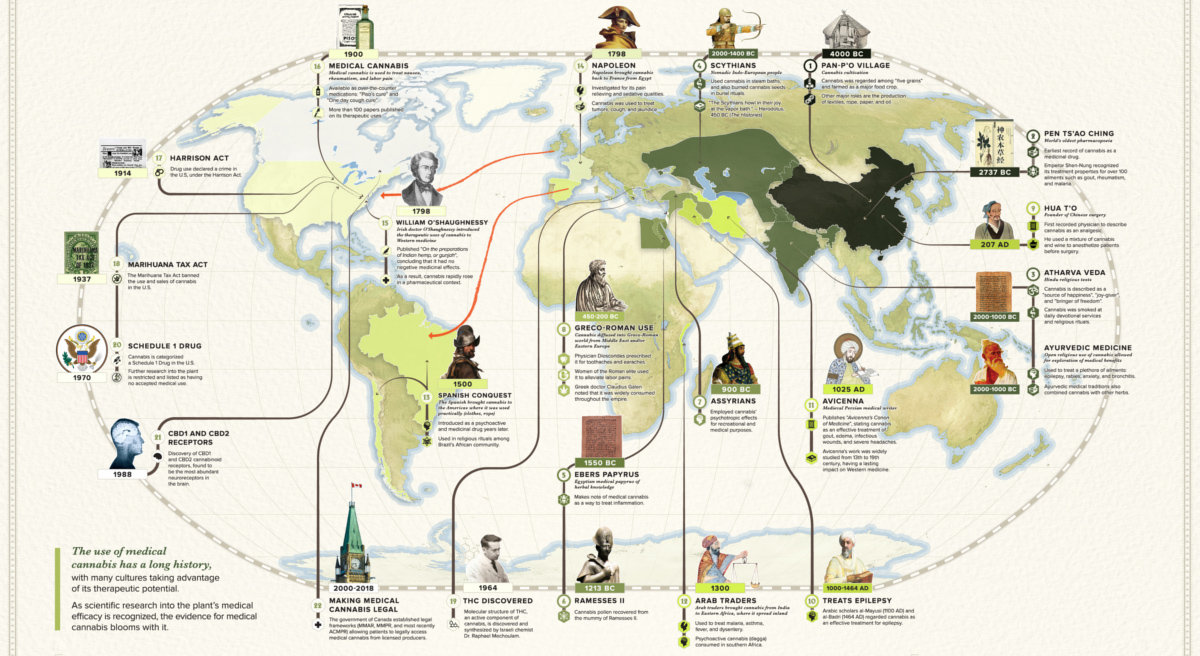
Medical cannabis has been used for its therapeutic properties for thousands of years, by many different cultures around the world.
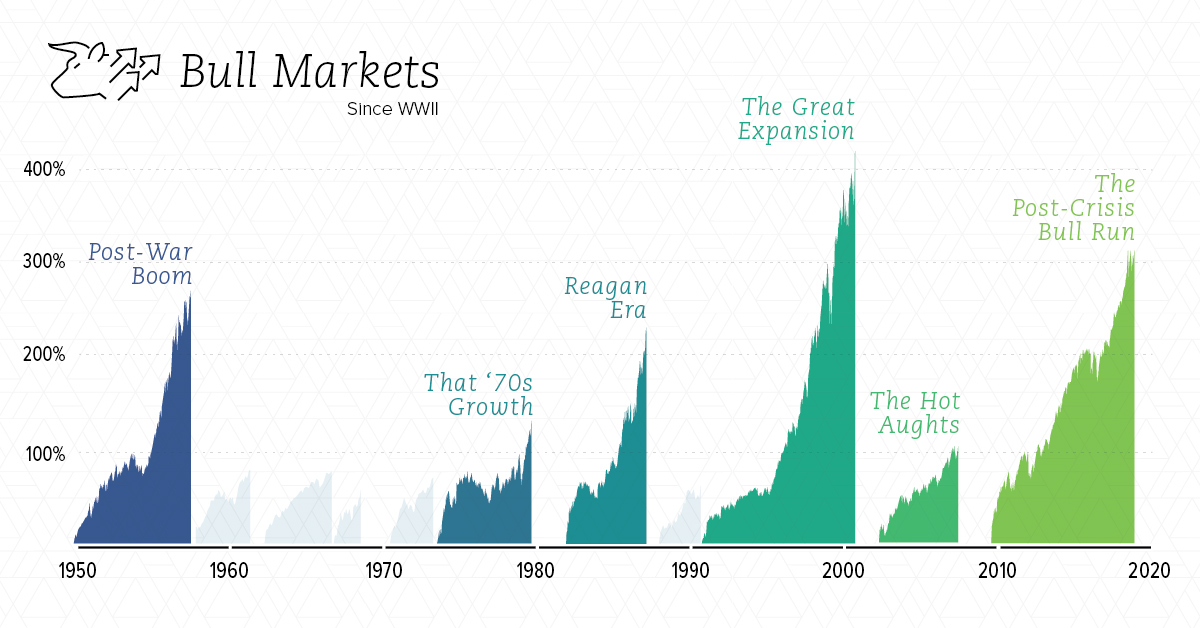
The duration and intensity of every bull market from WWII - plus, a look at the current run, which will become the longest in modern history...
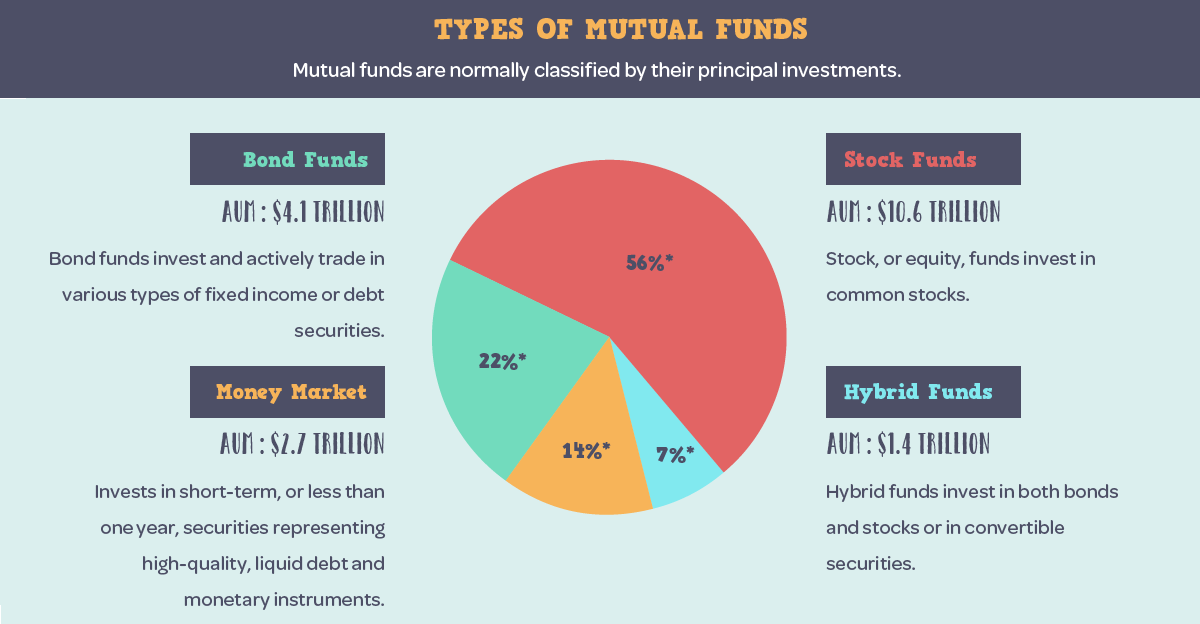
A look at mutual fund basics, their history, the different types of funds, and how today's mutual funds break down by country and assets under management.
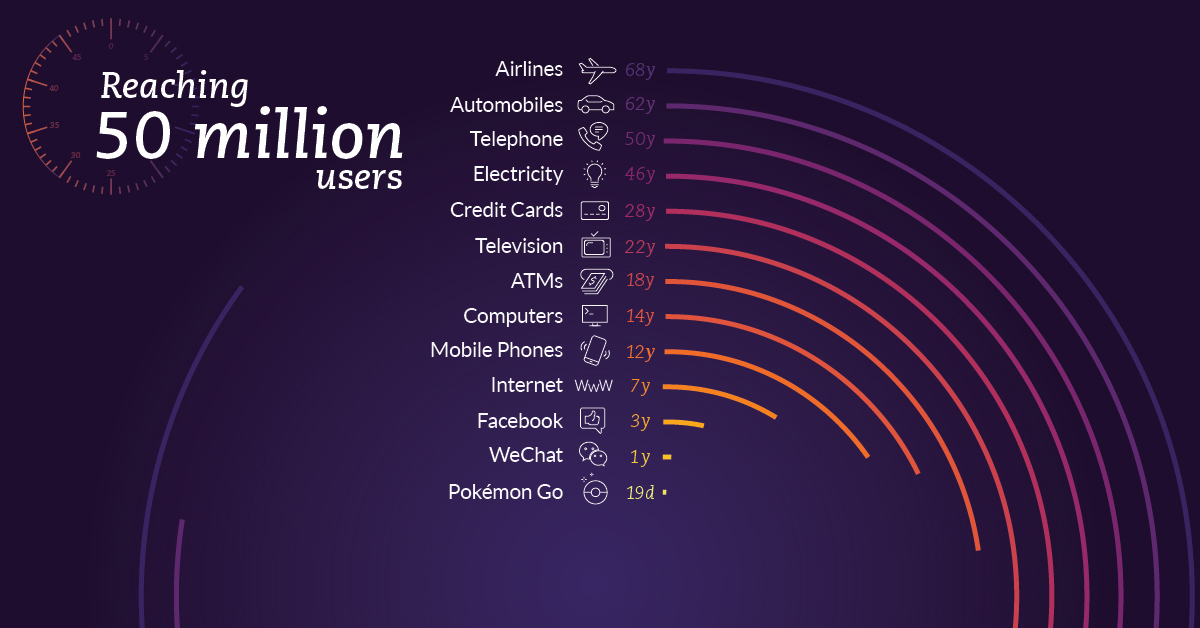
It used to take decades to accumulate 50 million users for a new product, but now it can be done in just days thanks to the...
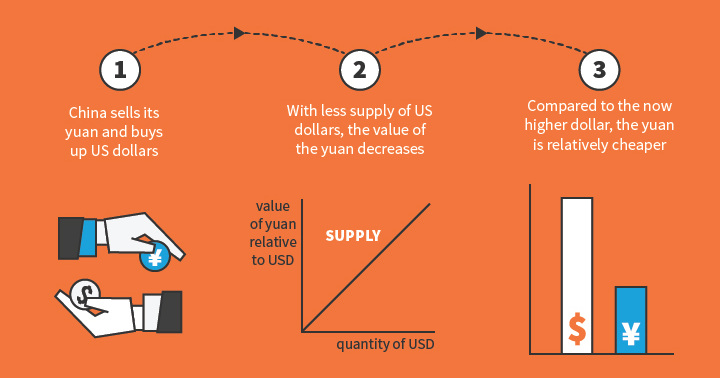
Why do the exchange rates between currencies fluctuate? This infographic looks at six major factors that drive these movements.
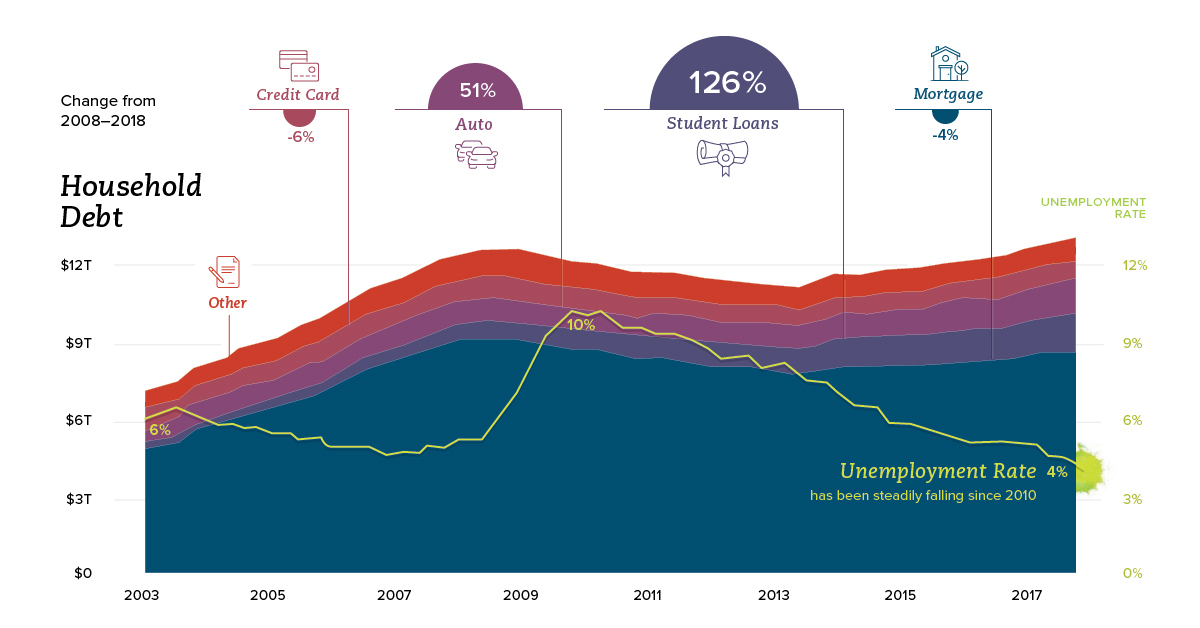
How are American household finances shifting in terms of income, savings, debt, and spending? This series of charts shows the trends you need to know.
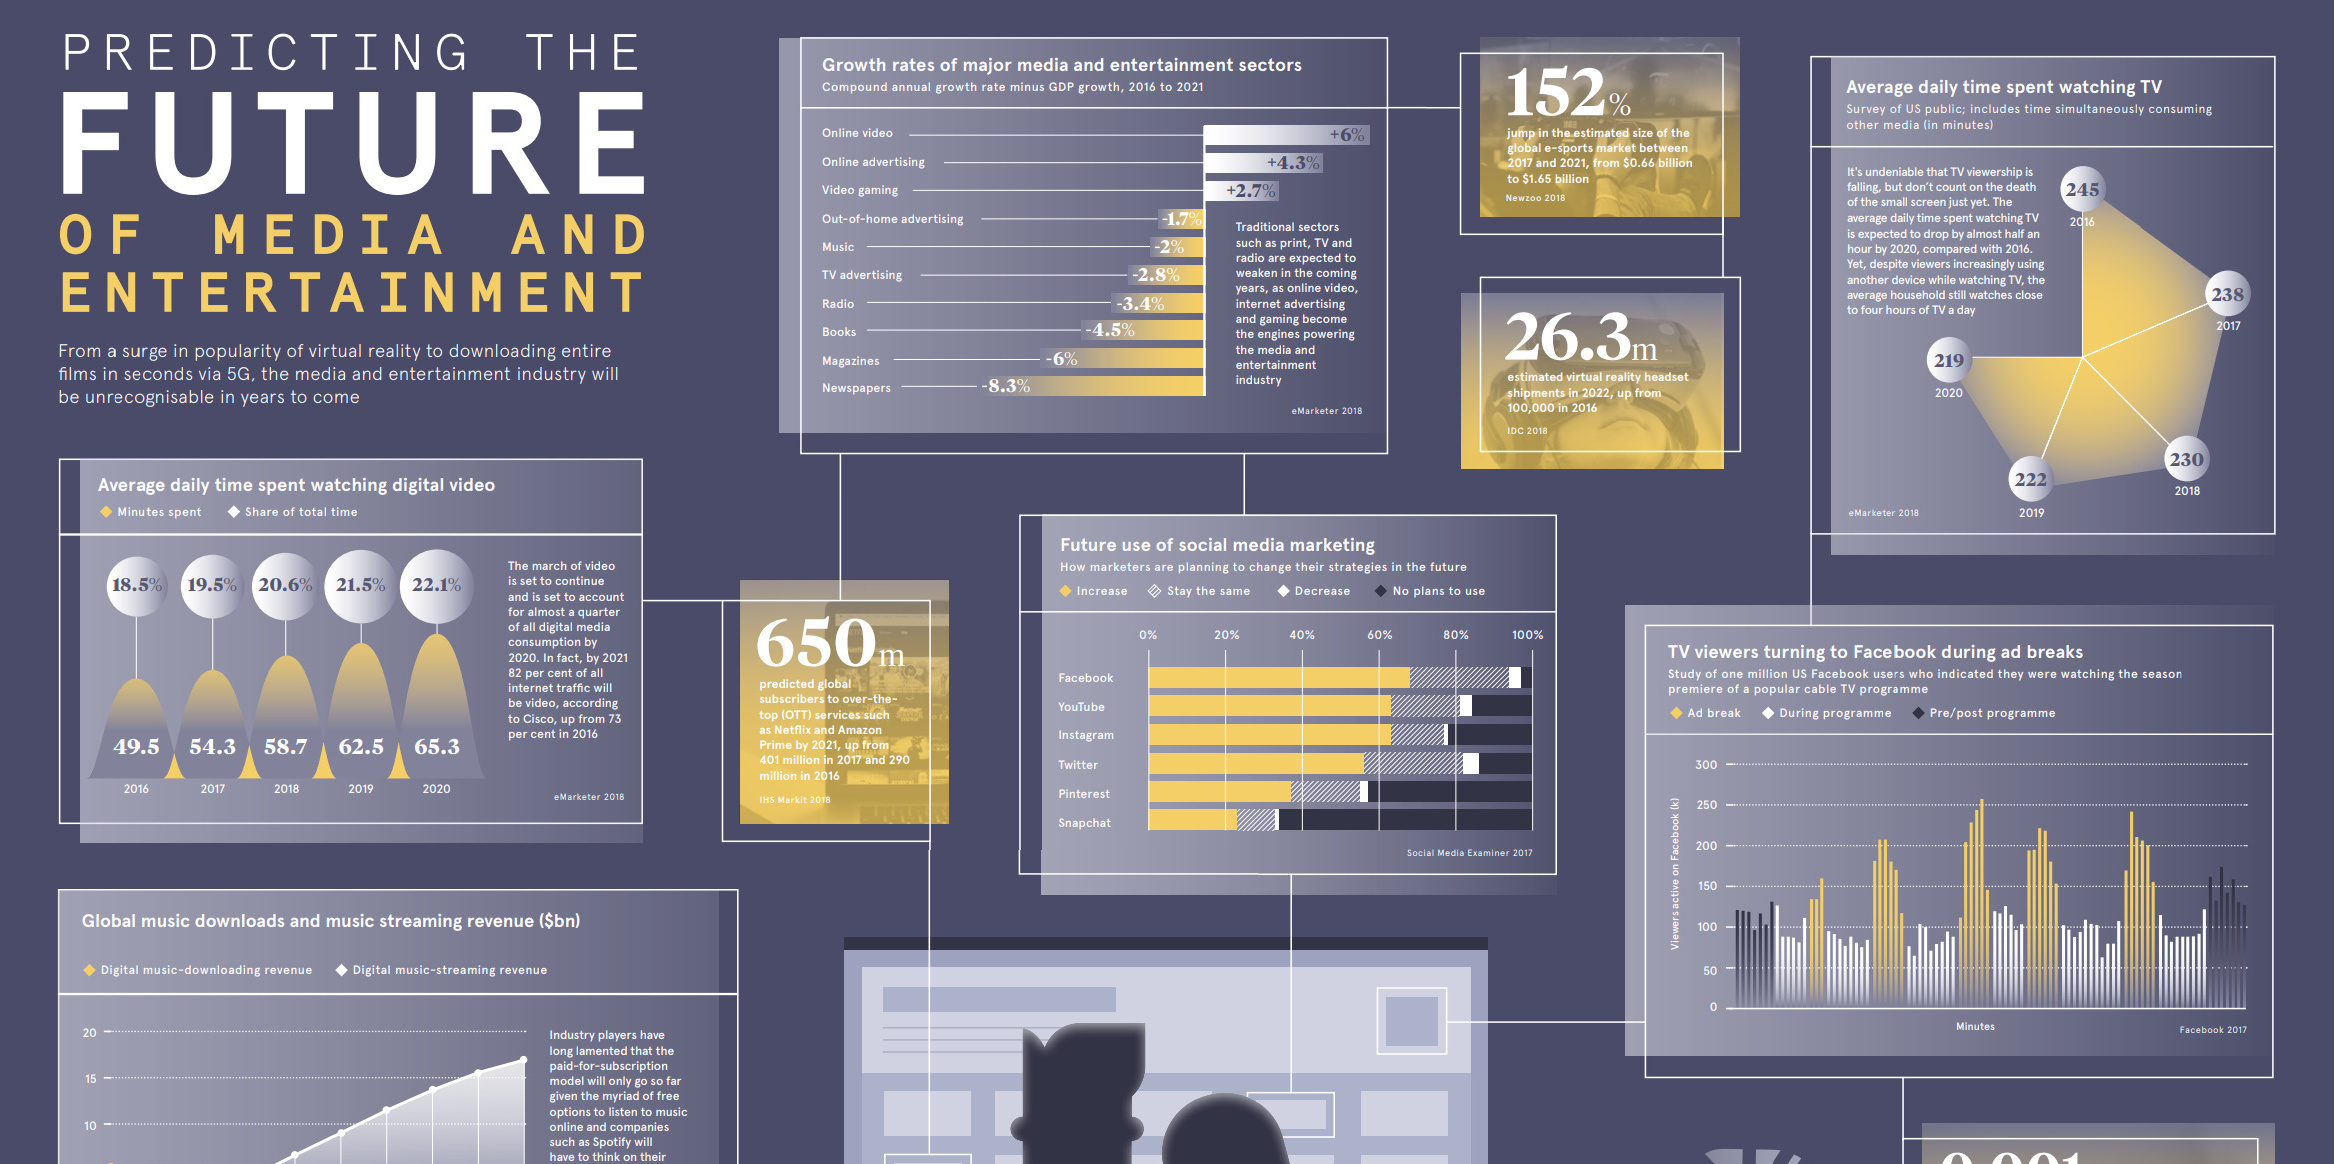
What technologies and trends are driving the future of media and entertainment? See the data in this large and information-packed infographic.
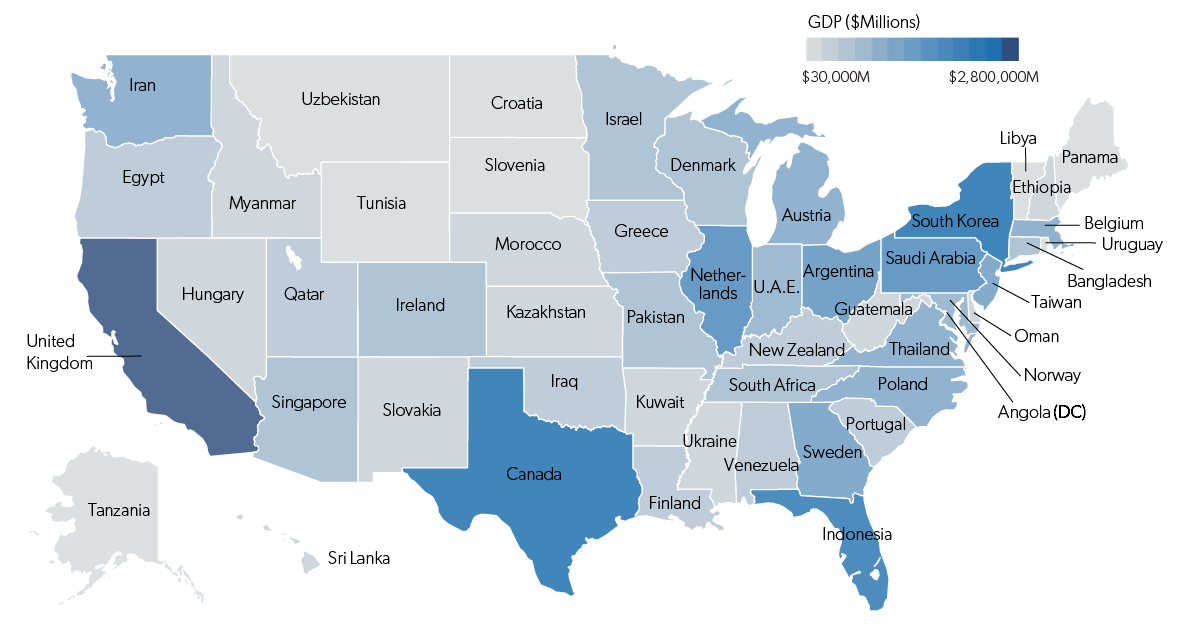
Each state has a GDP that is comparable in size to that of an actual country. This map shows it all, plus a full list of...


