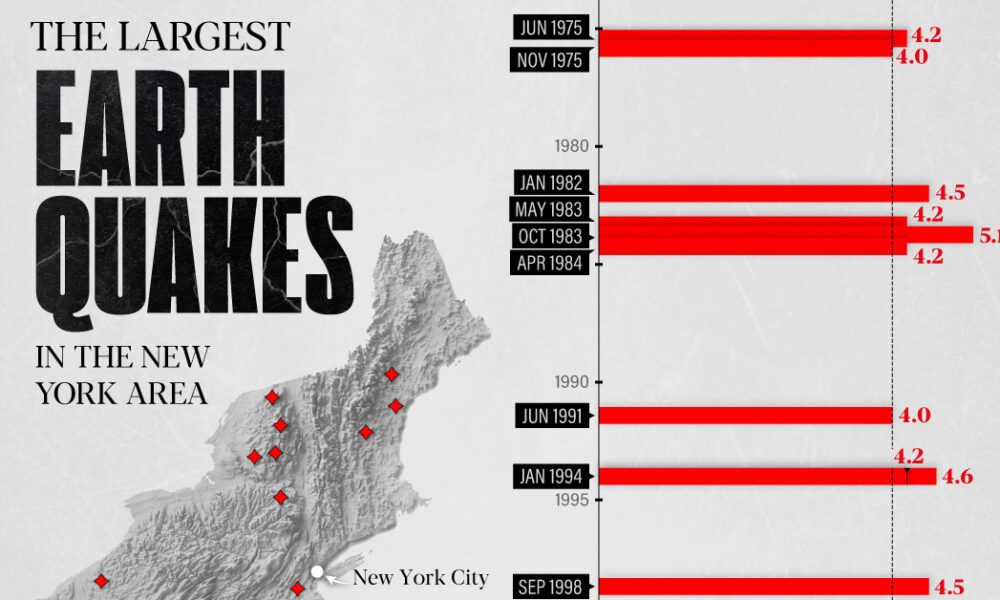
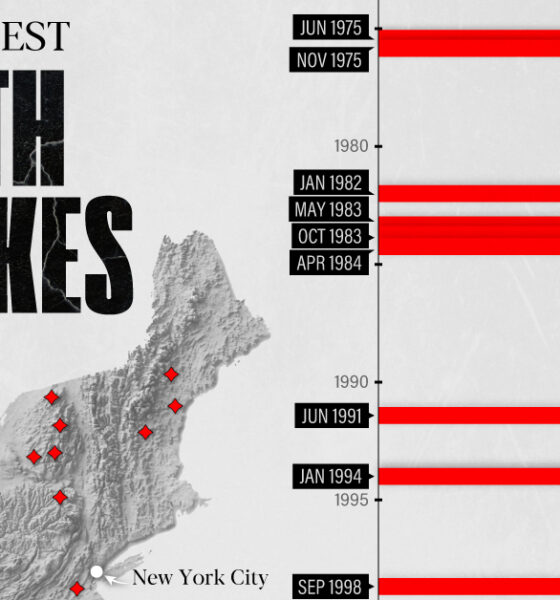
The earthquake that shook buildings across New York in April 2024 was the third-largest quake in the Northeast U.S. over...
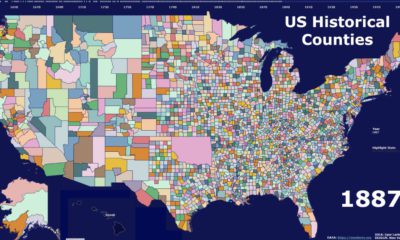

This video highlights the history of American counties, and how their boundaries have changed over the last 300 years.
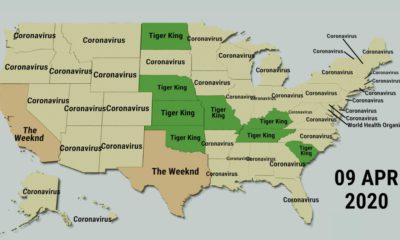

This fascinating animated map provides an overview of the top trending Google searches in every state over the last decade.
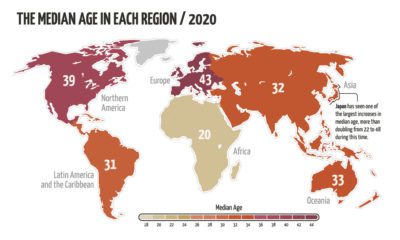

The world’s population is aging, but not at the same rate. This animated map visualizes the changes in median age in every region since 1950.
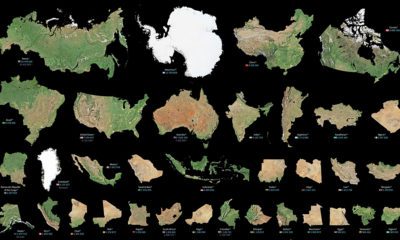

Maps can distort the size and shape of countries. This visualization puts the true size of land masses together from biggest to smallest.
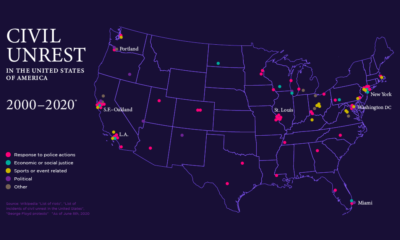

This map of civil unrest in the United States helps provide much needed context on how individual events fit within the nation-wide pattern over time.
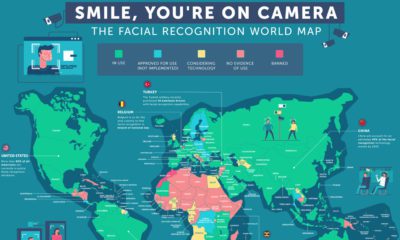

Mass surveillance is becoming the status quo. This map dives into the countries where facial recognition technology is in place, and how it's used.
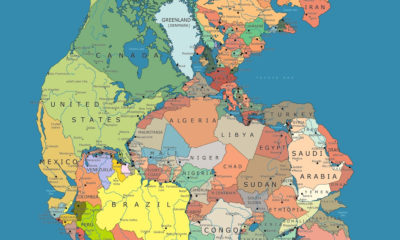

Many millions of years ago, the world was one. This nifty map shows this Pangea supercontinent overlaid with modern country borders.
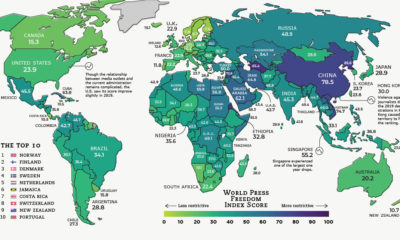

Global press freedom improved slightly in 2019, but censorship, intimidation, and violence remain a fact of life for many journalists around the world.
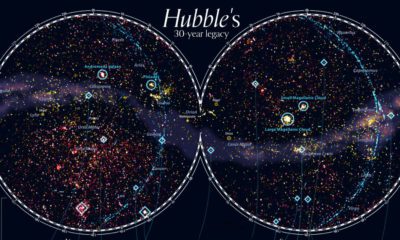

For 30 years, the Hubble Space telescope has been our eye into outer space. This stunning map looks at 550,000 observations made between 1990-2019.
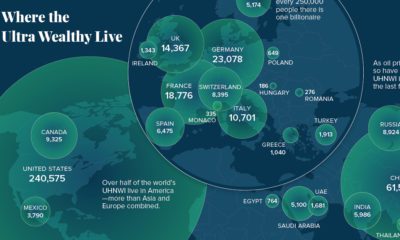

Here's where the world's ultra-rich (>$30 million in assets) live, and also how the landscape is projected to change over the coming years.


