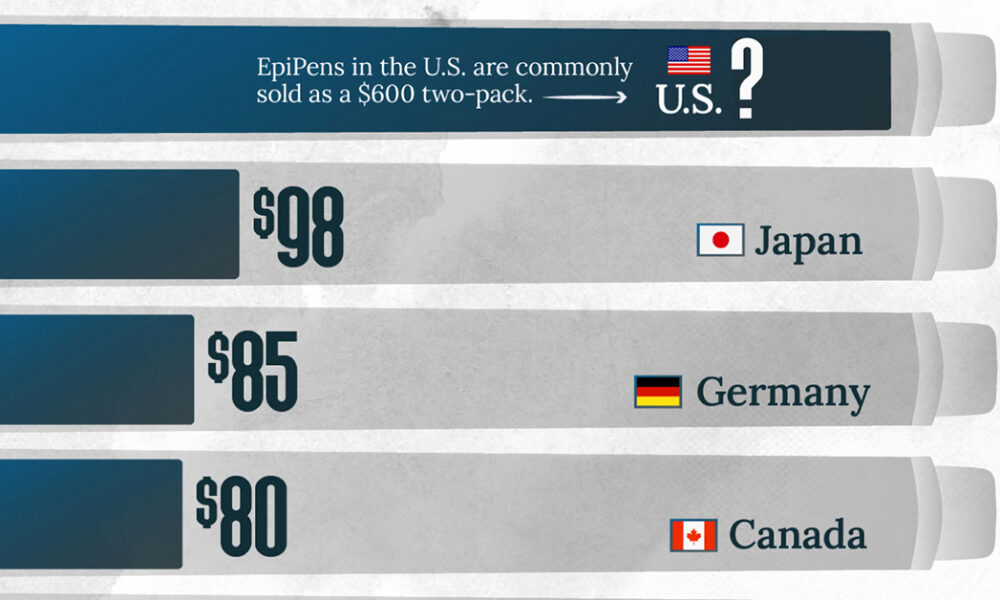
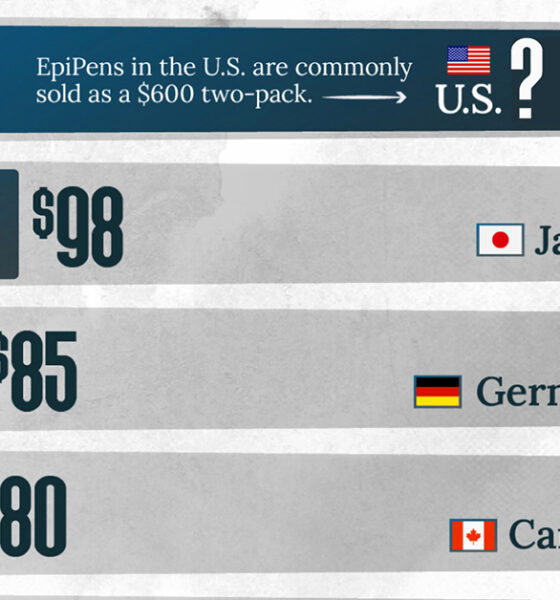
This visualization compares EpiPen prices around the world, with the U.S. having the highest prices by far.
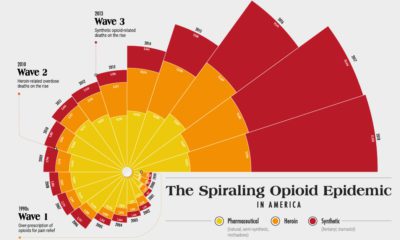

Since the 1990s, the opioid crisis has claimed thousands of lives. This visualization shows how the epidemic has come in three distinct waves.
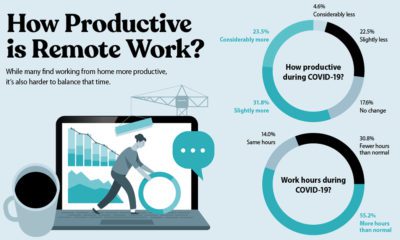

In an in-depth survey, startup founders and their teams revealed work-from-home experiences and their plans for a post-pandemic future.
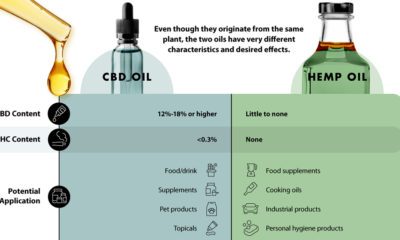

CBD Oil vs. Hemp Oil: What’s the Difference? For many consumers, cannabis plays a significant role in the treatment of medical conditions and managing general well-being....
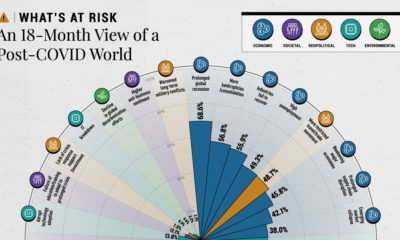

The WEF surveyed 347 risk analysts to uncover the most likely post-pandemic threats—and no area from the economy to the environment is untouched.
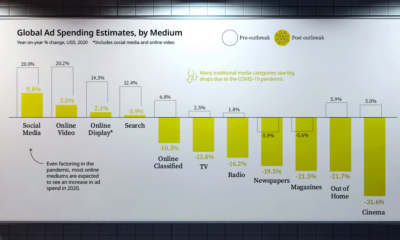

Global advertising spending is estimated to see $50 billion decline across various mediums and industries as a result of COVID-19.
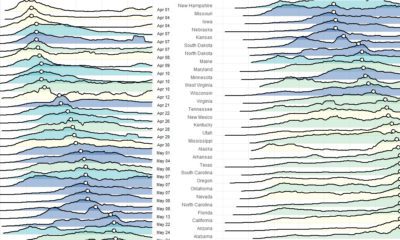

These charts and maps show the evolution of COVID-19's spread in the United States, by organizing data based on peak case and death dates.
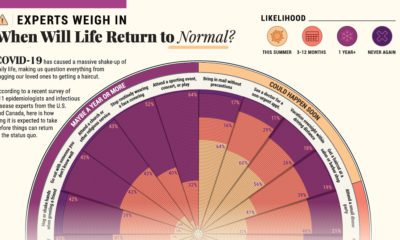

COVID-19 has caused a massive shake-up of our daily lives. Here, 511 epidemiologists offer their insights on when they might resume 20 common activities.
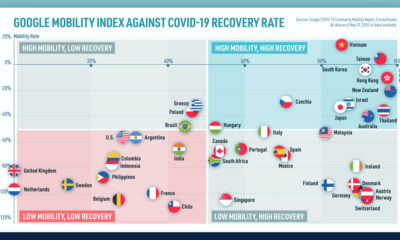

We look at mobility rates as well as COVID-19 recovery rates for 41 economies, to see which countries are reopening for business.
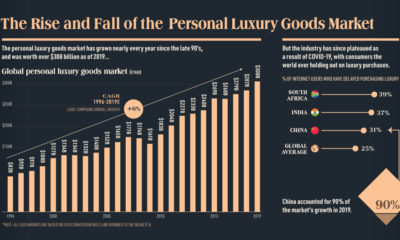

This infographic charts the rise and fall of the $308 billion global personal luxury market, and explores what the coming year holds for its growth
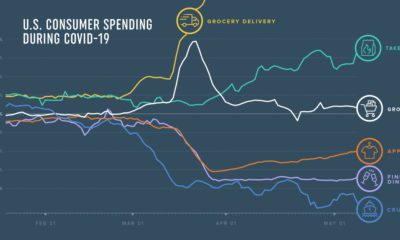

How has COVID-19 transformed consumer spending trends so far? We look at credit and debit card spending of 5 million U.S. consumers across 18 categories.


