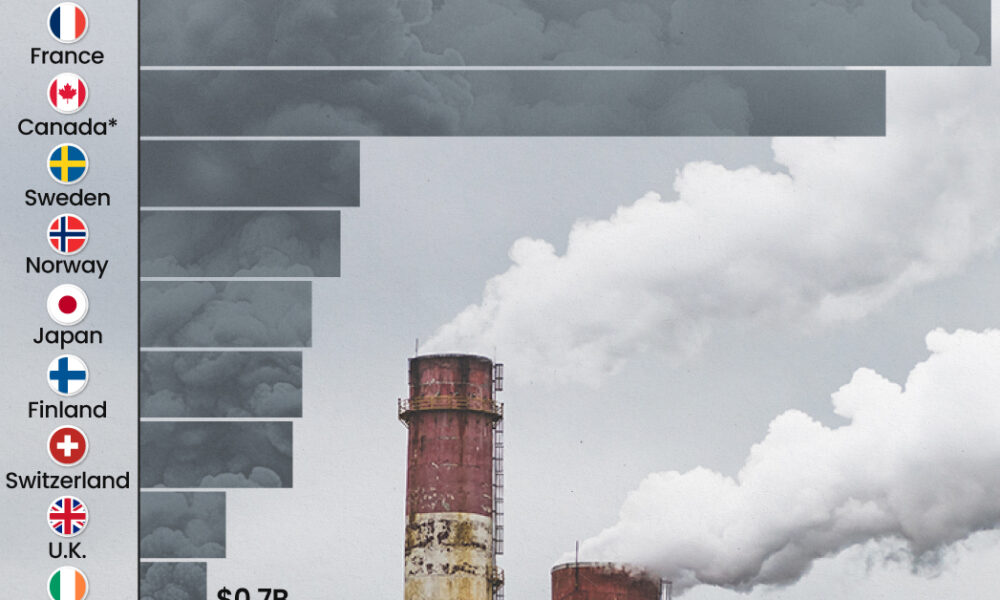
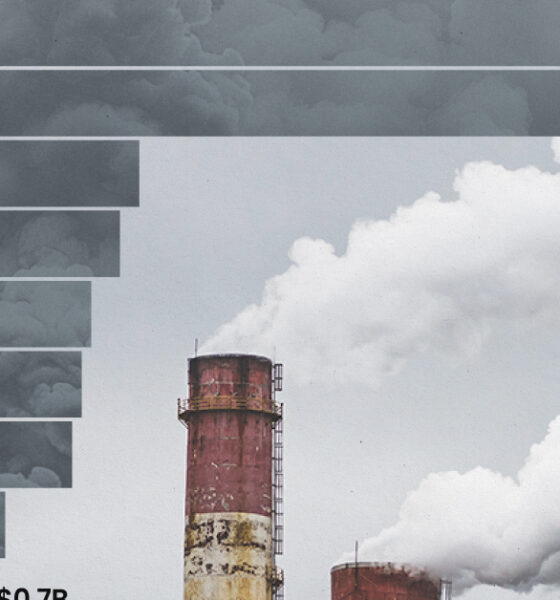
This graphic highlights France and Canada as the global leaders when it comes to generating carbon tax revenue.
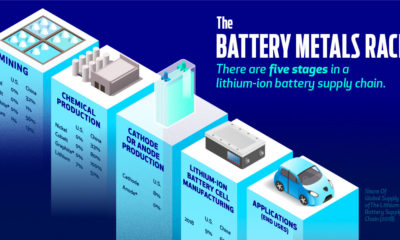

Is the U.S. positioned to win the battery arms race, or will China remain in control of the world's transition to renewable energy?
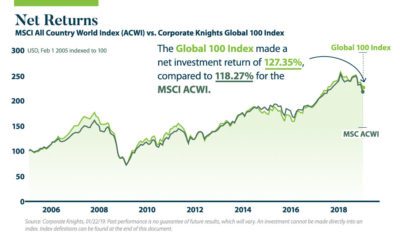

Do sustainable strategies underperform conventional ones? This infographic shines a light on the realities of sustainable investing and the ESG framework.
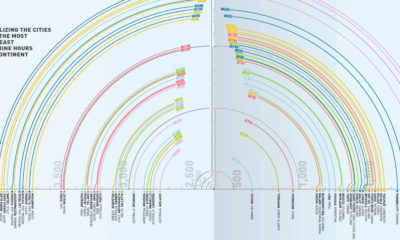

While we all see the same sky, some see it differently, depending on where they live. Today's graphic ranks world cities by annual hours of sunshine.
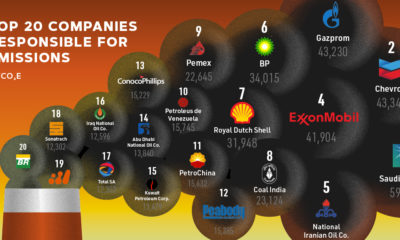

Since 1965, over ⅓ of the world’s cumulative carbon emissions can be traced back to just 20 fossil fuel companies. Who are the biggest contributors?
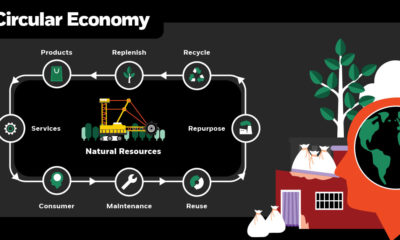

Our modern world was designed for mass consumption and waste. Choosing to build a circular economy will be integral to the future of our planet.
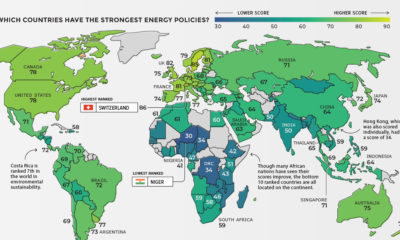

Which countries are able to balance prosperity and sustainability in their energy mixes? See the countries with the most sustainable energy policies.
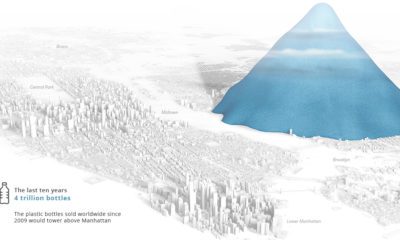

Today's stunning visualization depicts the incredible scale of plastic bottle waste accumulated globally in each hour, day, month, year, and decade.

Learn how climate change and resource scarcity are affecting our most basic needs, and how investors can take advantage of this growing megatrend.
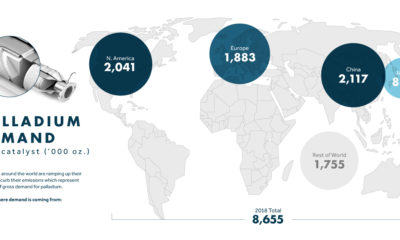

The world is in critical need of palladium. It's a crucial metal in reducing emissions from gas-powered vehicles, and our secret weapon for cleaner air.
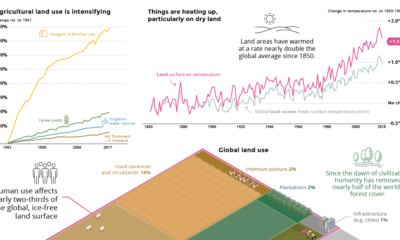

We highlight the five most important takeaways from the IPCC's recent 1,400+ page report on climate change and land use.


