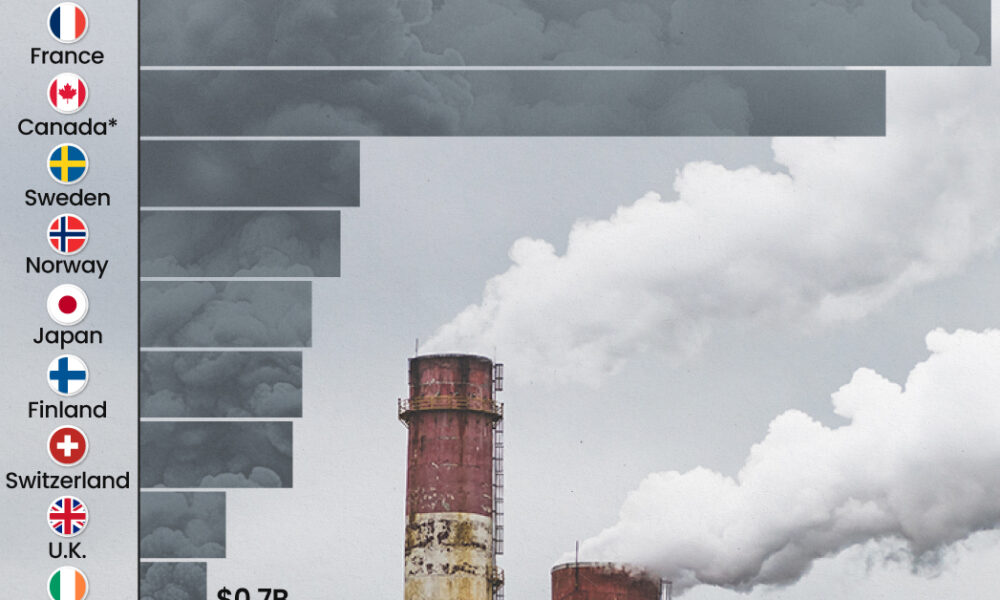
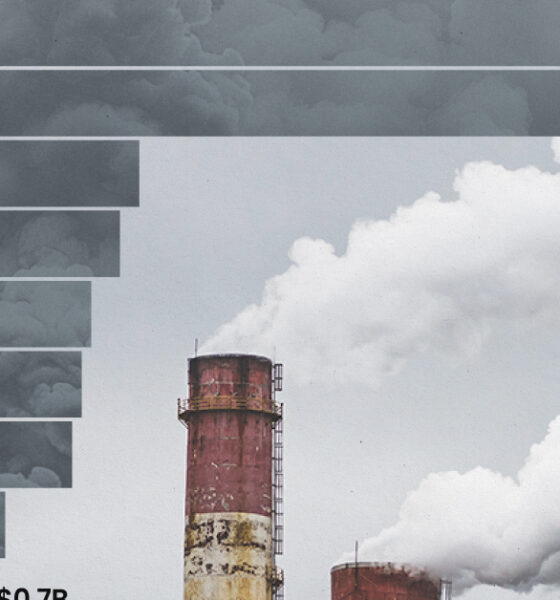
This graphic highlights France and Canada as the global leaders when it comes to generating carbon tax revenue.
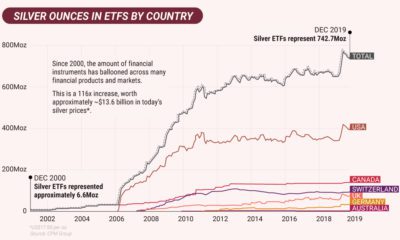

In the second part of the Silver Series, we show that the supply and demand fundamentals are potentially shaping up for a perfect storm in silver...
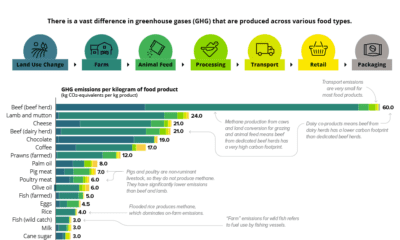

According to the largest ever meta-analysis of food systems, the carbon footprint of different types of food in your diet can vary widely.
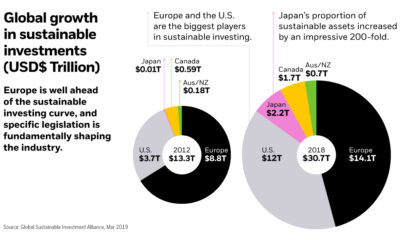

Total assets in sustainable investing reached nearly $31 trillion in 2018. What are the driving forces behind the global rise of sustainable investing?
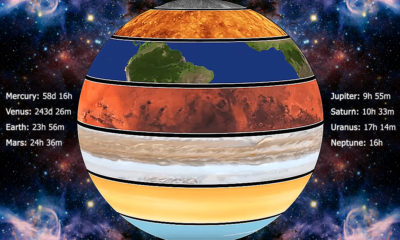

Rotation can have a big influence on a planet's habitability. These animations show how each planet in the solar system moves to its own distinct rhythm.
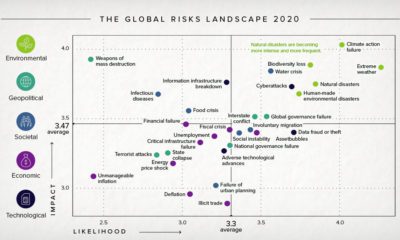

The Global Risk Report 2020 paints an unprecedented risk landscape for 2020—one dominated by climate change and other environmental concerns.
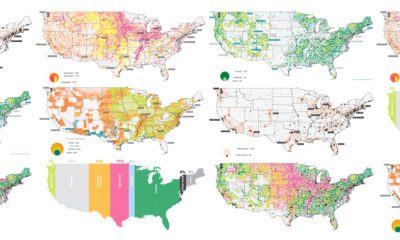

The U.S. covers an immense 3.8 million square miles—what is all this land currently used for, and what does that mean for the future?
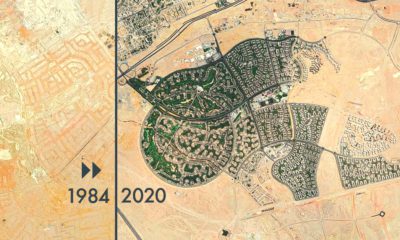

From rapid urbanization to retreating glaciers, these timelapsed satellite maps capture the drastic changes the Earth's surface has undergone.
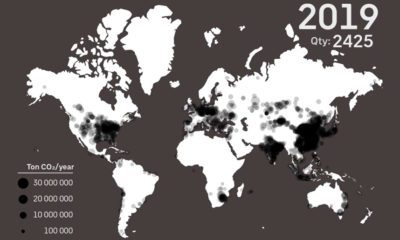

See every major coal power plant ever commissioned on this animation, which covers a time period from 1927 until 2019.
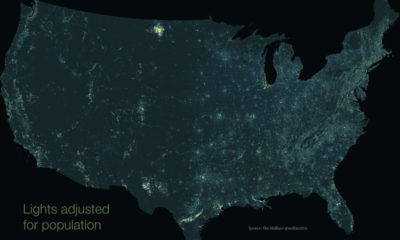

This unique map subtracts population from nighttime light output, giving us a unique perspective into America's rural light pollution hot spots.
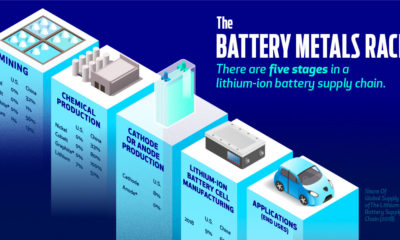

Is the U.S. positioned to win the battery arms race, or will China remain in control of the world's transition to renewable energy?


