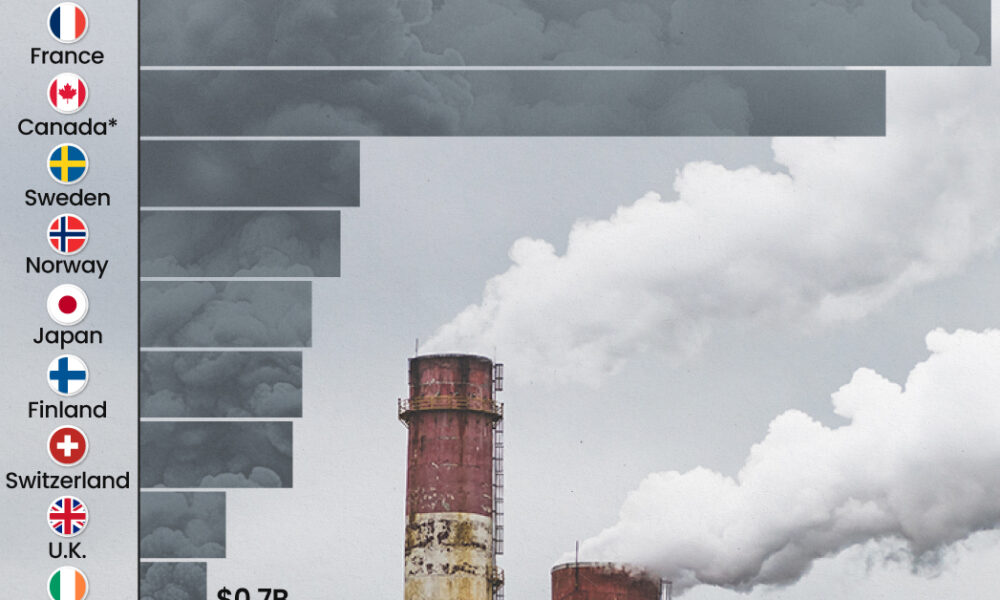
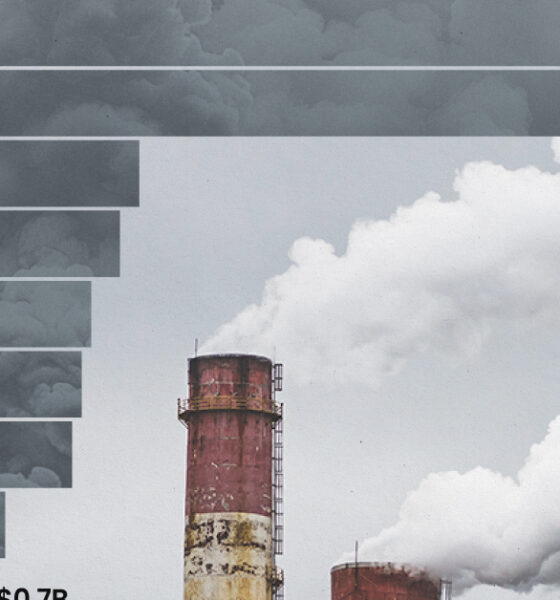
This graphic highlights France and Canada as the global leaders when it comes to generating carbon tax revenue.
Nuclear power accounted for 10% of global electricity generated in 2020. Here's a look at the largest nuclear power producers.
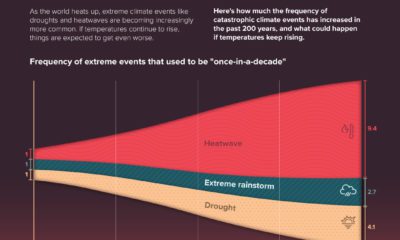

Extreme weather events, like droughts and heatwaves, have become more common over the years. But things are expected to get worse.
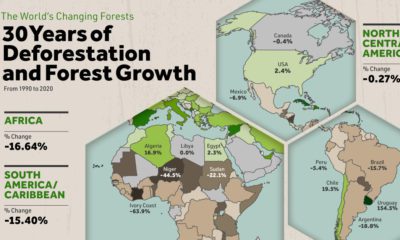

Where are the world's forests still shrinking, and where are they seeing net gains? We map deforestation by country between 1990-2020.
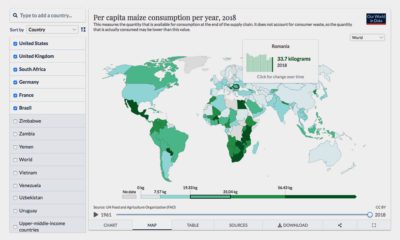

Where does your favorite food come from? Here's an interactive look at global food production.
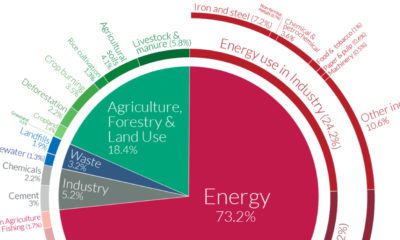

A Global Breakdown of Greenhouse Gas Emissions by Sector In a few decades, greenhouse gases (GHGs)—chiefly in the form of CO₂ emissions—have risen at unprecedented rates...
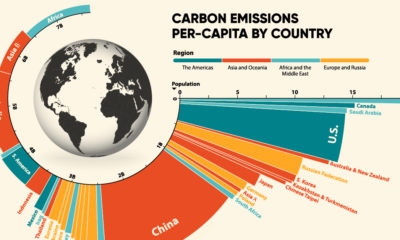

33.6 Gt of CO2 was emitted across the world in 2019. Here we visualize the global per capita CO2 emissions by country and region.
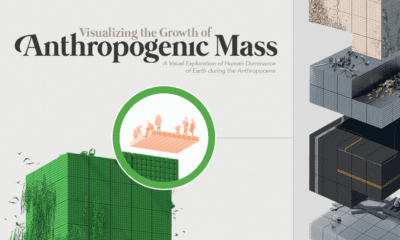

The amount of human-made (or anthropogenic) mass, has now exceeded the weight of all life on Earth, including humans, animals, and plants.

A unique and entertaining graphic that compares the depth of the world's lakes and oceans, as well as the deepest holes ever drilled.


In 2020, solar power saw its largest-ever annual capacity expansion at 127 gigawatts. Here's a snapshot of solar power capacity by country.
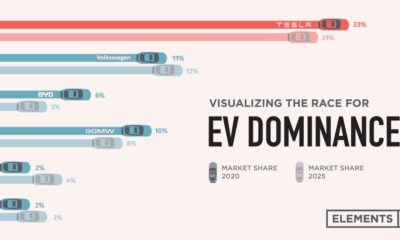

Tesla was the first automaker to hit a $1 trillion market cap, but other electric car companies have plans to unseat the dominant EV maker.


 Creator Program