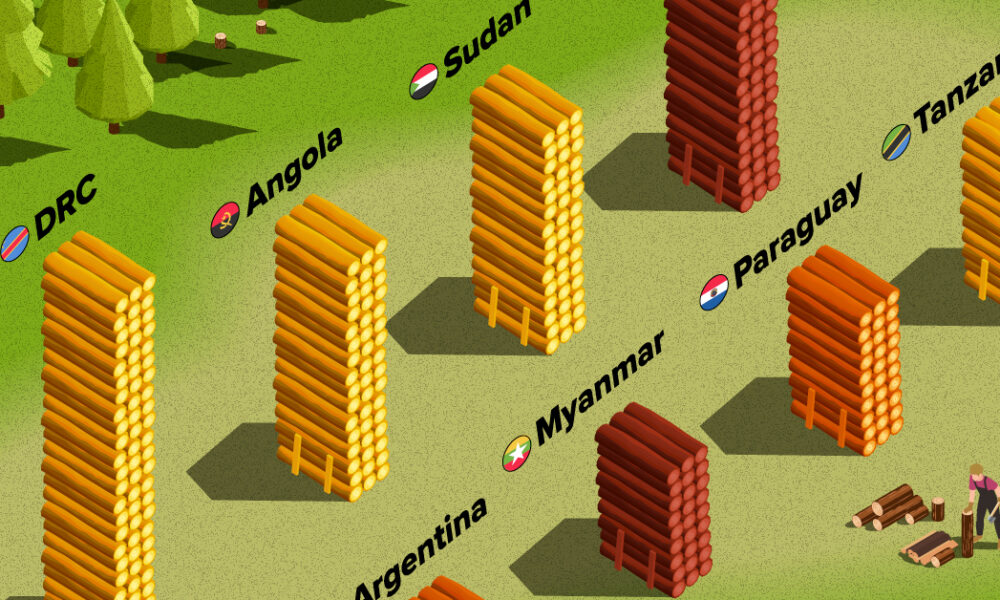
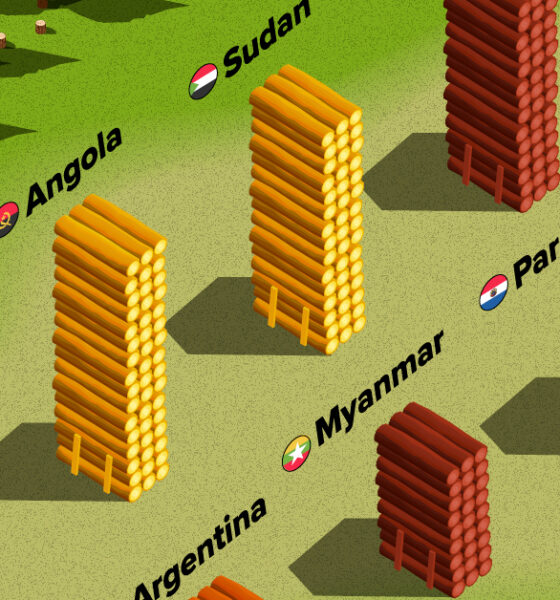
The country with the most forest loss since 2001 lost as much forest cover as the next four countries combined.
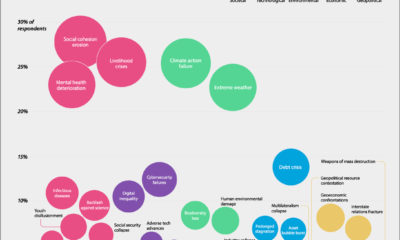

According to the World Economic Forum, the erosion of social cohesion is one of the risks that has worsened the most since COVID-19.

This map visualizes Earth’s seasons, showing how our planet’s Arctic sea ice and vegetation changes throughout the year.
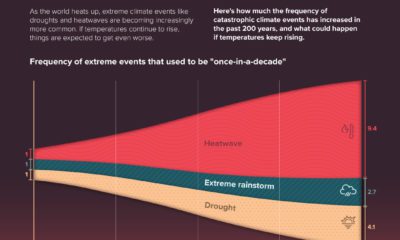

Extreme weather events, like droughts and heatwaves, have become more common over the years. But things are expected to get worse.
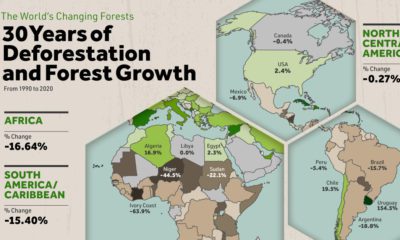

Where are the world's forests still shrinking, and where are they seeing net gains? We map deforestation by country between 1990-2020.
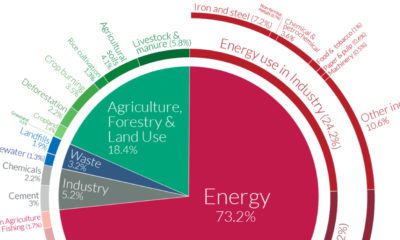

A Global Breakdown of Greenhouse Gas Emissions by Sector In a few decades, greenhouse gases (GHGs)—chiefly in the form of CO₂ emissions—have risen at unprecedented rates...
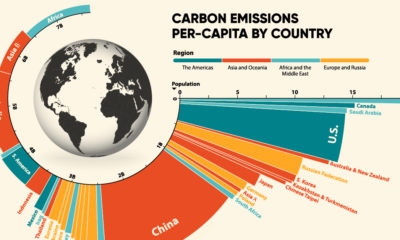

33.6 Gt of CO2 was emitted across the world in 2019. Here we visualize the global per capita CO2 emissions by country and region.


In 2020, solar power saw its largest-ever annual capacity expansion at 127 gigawatts. Here's a snapshot of solar power capacity by country.
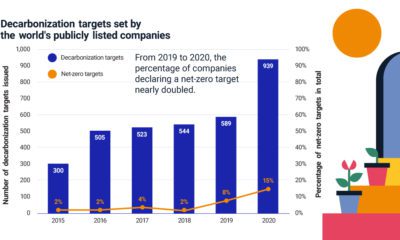

More companies are declaring net-zero emissions targets, but where can they start? Find out the steps companies and investors can take.
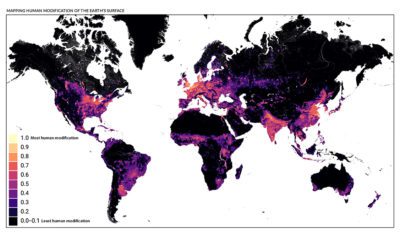

This detailed map looks at where humans have (and haven't) modified Earth's terrestrial environment. See human impact in incredible detail.
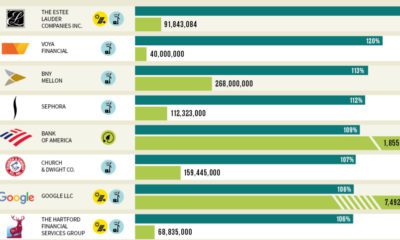

Which U.S. companies use the most green energy as a percentage of total energy used? Here are the 50 highest ranked companies according to the EPA.


 Creator Program