
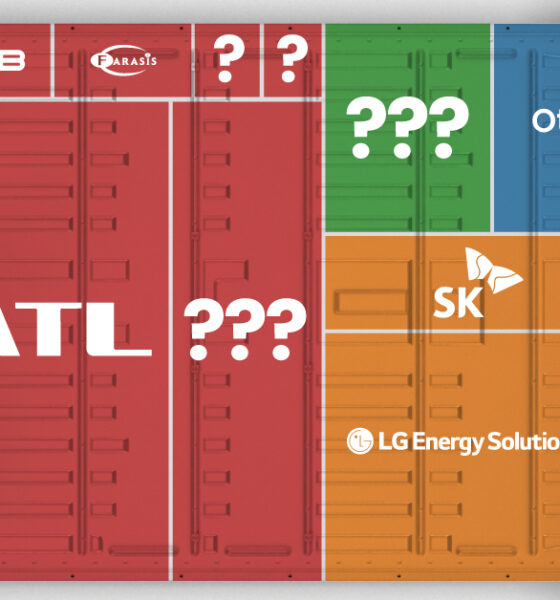
Asia dominates this ranking of the world's largest EV battery manufacturers in 2023.
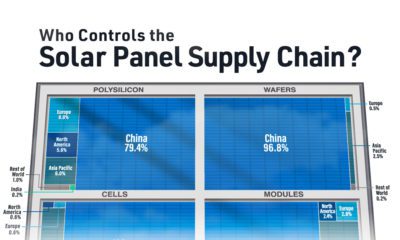

The supply chain is key for the renewable energy revolution, and this chart visualizes where the world's solar panels are manufactured.
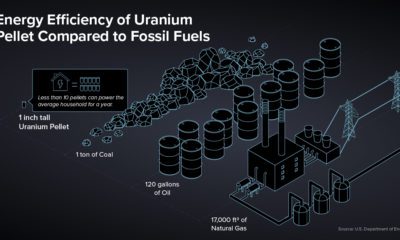

As the only fuel source of low-carbon, scalable, reliable, and affordable electricity, nuclear will play a prominent role in the clean energy transition.
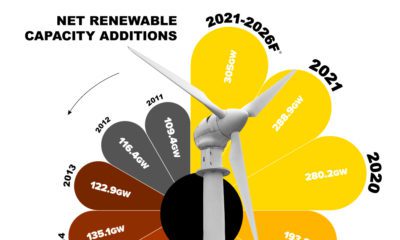

This infographic explores the exponential growth of the technologies that are shaping the new era of energy.
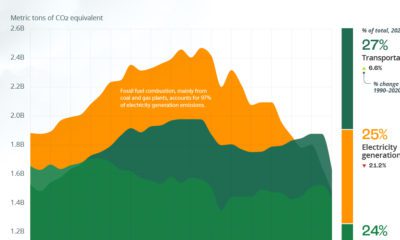

The U.S. emits about 6 billion metric tons of greenhouse gases a year. Here's how these emissions rank by sector.
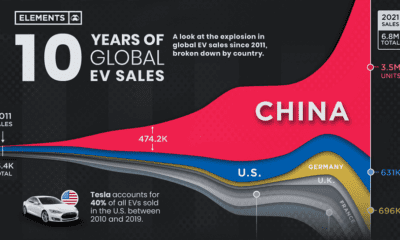

Global EV sales have grown exponentially, more than doubling in 2021 to 6.8 million units. Here's a look at EV sales by country since 2011.
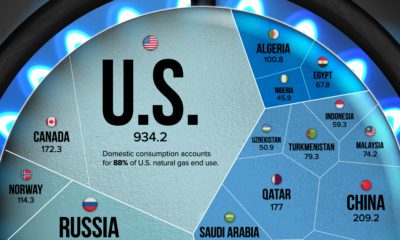

Natural gas prices have risen since Russia's invasion of Ukraine. This visualization highlights the world’s largest natural gas producers.
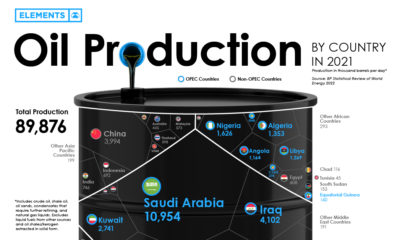

Global oil production averaged 89.8 million barrels of oil per day in 2021. Here are the world's largest oil producers.
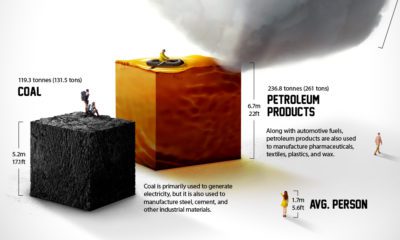

Each year the average American consumes more than 23 barrels of petroleum products. What does a lifetime of fossil fuel consumption look like?
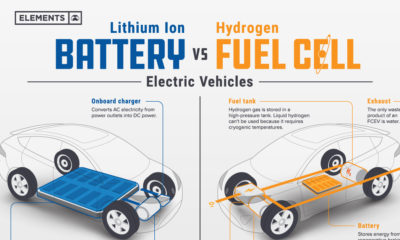

Understand the science behind hydrogen fuel cell vehicles, and how they differ from traditional EVs.


Wind is a great renewable energy source, but the spread of potential power is uneven. This graphic maps the average wind speed of the continental U.S.


 Creator Program