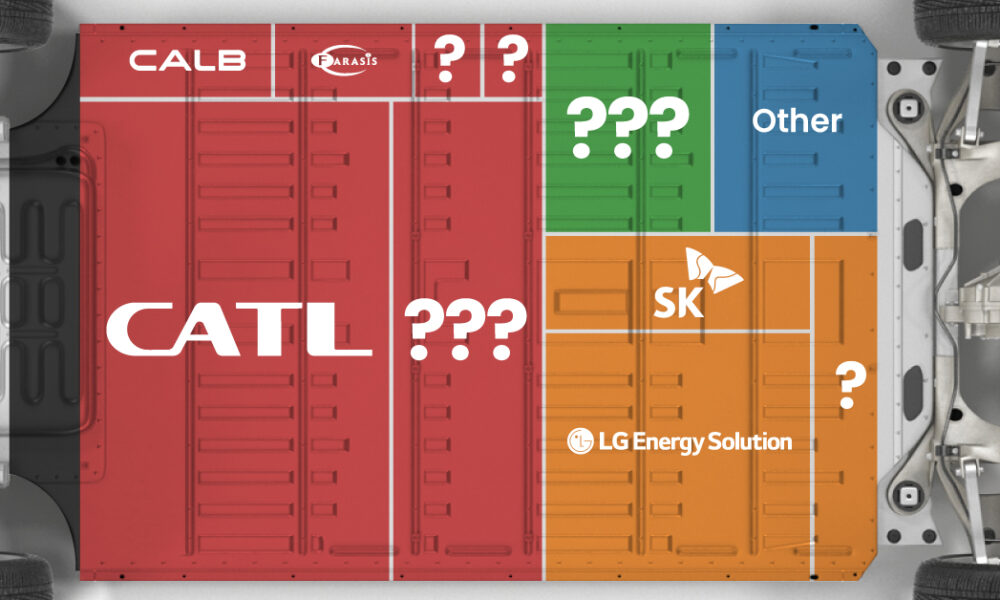
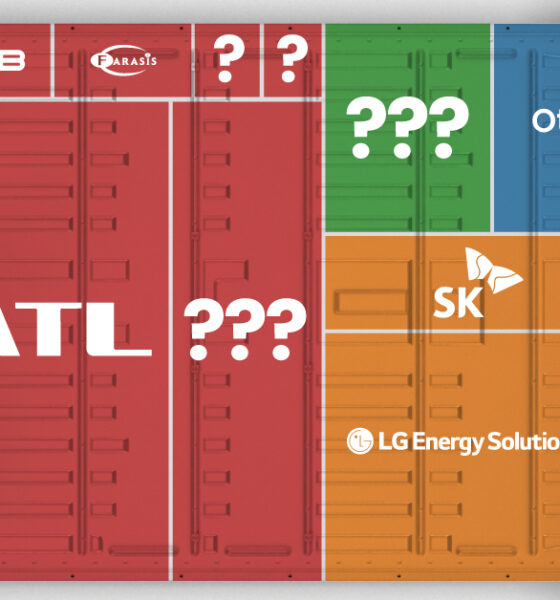
Asia dominates this ranking of the world's largest EV battery manufacturers in 2023.
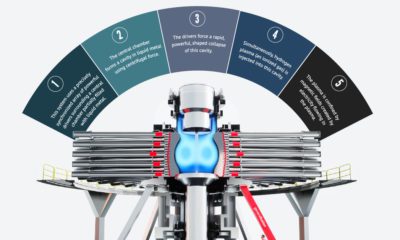

Fusion has the potential to deliver clean, abundant, reliable, and cost-competitive energy.
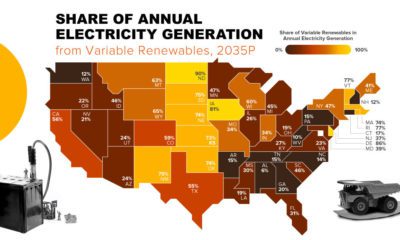

As the U.S. transitions to clean energy, investing in battery metals like lithium and cobalt can help secure an energy-independent future.
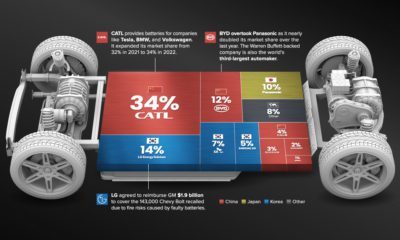

Despite efforts from the U.S. and Europe to increase the domestic production of batteries, the market is still dominated by Asian suppliers.
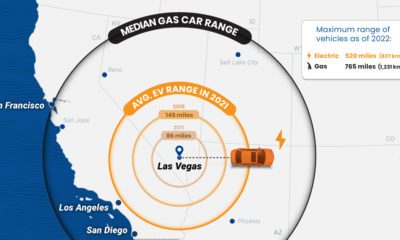

With range anxiety being a barrier to EV adoption, how far can an electric car go on one charge, and how do EV ranges compare with...
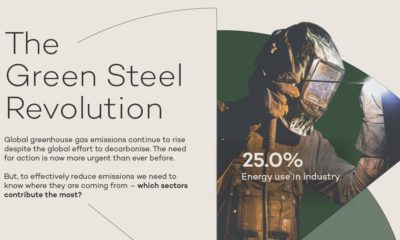

How will high emission industries respond to climate change? We highlight industrial emissions and hydrogen's role in green steel production.
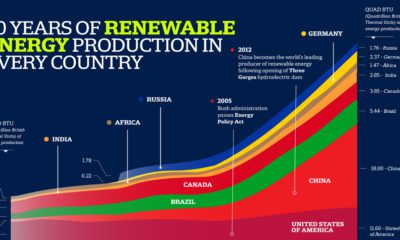

Here's a snapshot of global energy production, and which countries have produced the most fossil fuels, nuclear, and renewable energy since 1980.
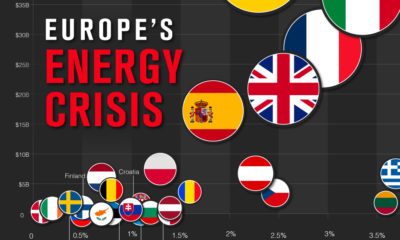

As European gas prices soar, countries are introducing policies to try and curb the energy crisis.
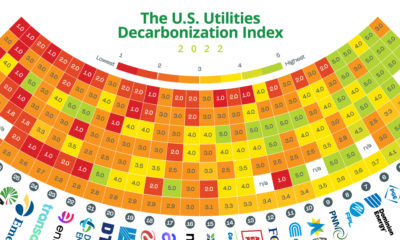

This graphic quantifies and compares the state of decarbonization among the 30 largest investor-owned utilities in the United States.
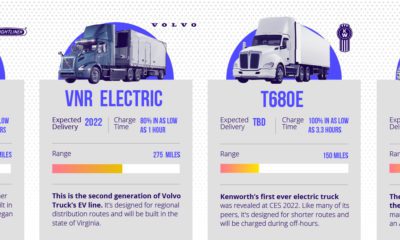

A wave of electric semi trucks is expected to arrive over the next few years. View this infographic to learn more.
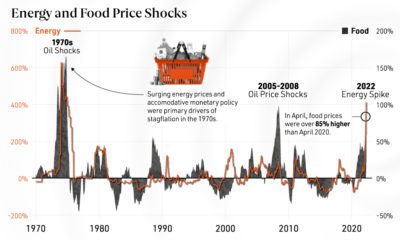

From rising inflation to food insecurity, we show why energy price shocks have far-reaching effects on the global economy.


 Creator Program