China has grown its nuclear capacity over the last decade, now ranking second on the list of top nuclear energy...


Asia is on its way to account for half of the world’s electricity generation by 2025. How is this growing demand currently being met?


While Russia still makes billions from fossil fuel exports, revenues are declining. Here are the largest importers since the start of the invasion.
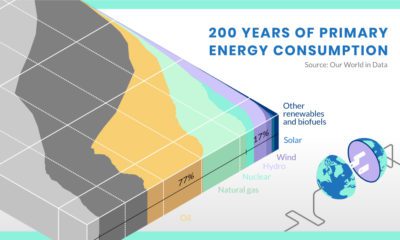

What have energy transitions looked like in the past, and what can we learn from them?


As Europe and the EU shift away from fossil fuels, which energy sources are European countries depending on for their electricity generation?


How much oil, coal, and natural gas do we extract each year? See the scale of annual fossil fuel production in perspective.


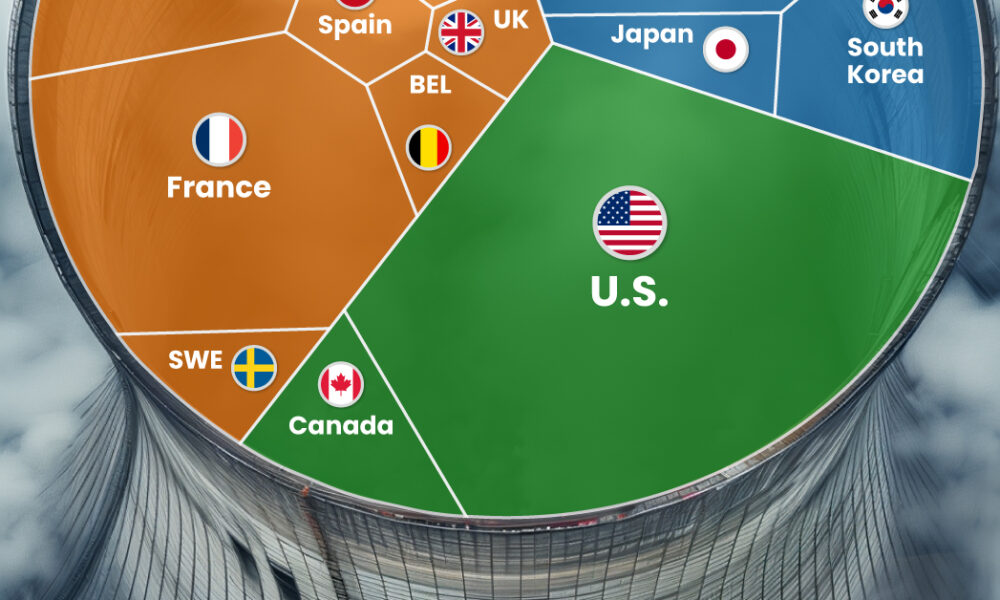
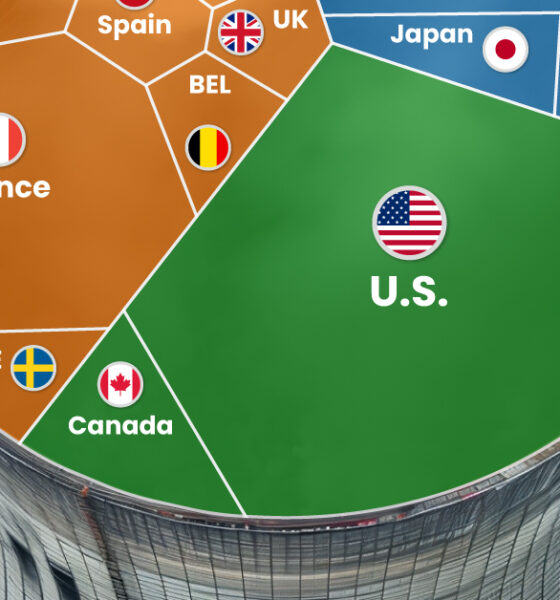
Wealthy countries consume large amounts of natural resources per capita, and the U.S. is no exception. See how much is used per person.


This infographic breaks down battery manufacturing capacity by country in 2022 and 2027.


This table shows the fluctuating returns for various commodities over the past decade, from energy fuels to industrial and precious metals.
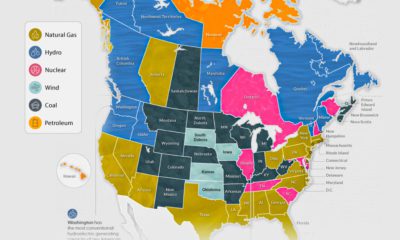

The U.S. and Canada rely on a different makeup of sources to generate their electricity. How does each state and province make theirs?


Using our database of 500+ predictions from reports, articles, interviews, and more, we highlight what experts think will happen in 2023


