

China has grown its nuclear capacity over the last decade, now ranking second on the list of top nuclear energy...
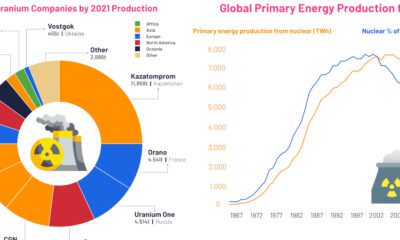

These visuals highlight the uranium mining industry and its output, as well as the trajectory of nuclear energy from 1960 to today.


How much oil is saved by adding electric vehicles into the mix? We look at data from 2015 to 2025P for different types of EVs.
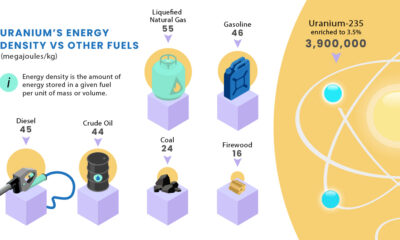

Explore how the unique features of uranium translate into advantages for nuclear power.
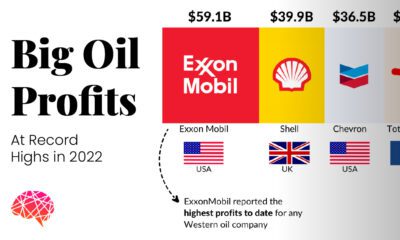

This visual highlights the five big oil companies that doubled their individual profits and earned a cumulative profit of over $200 billion in 2022.
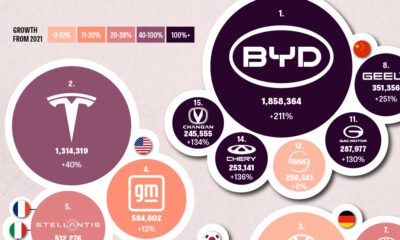

This graphic explores the latest EV production data for 2022, which shows BYD taking a massive step forward to surpass Tesla.
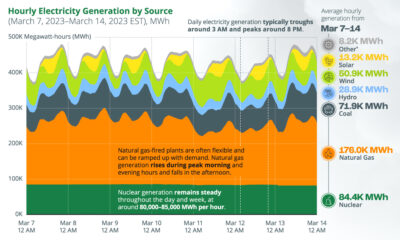

This chart tracks U.S. hourly electricity generation over one week, with various sources producing electricity at different times of the day.


As the market for low-emission solutions expands, China dominates the production of clean energy technologies and their components.
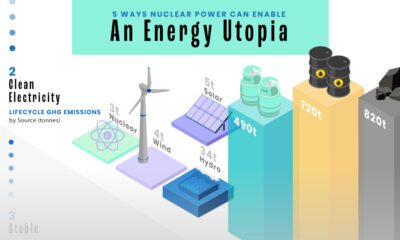

From clean electricity to high reliability, this graphic explores the five key advantages of nuclear power in the clean energy transition.
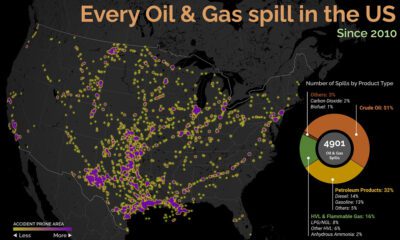

Oil and gas spills can be messy, but where are they most likely to occur? This graphic looks at oil and gas spills in the U.S....
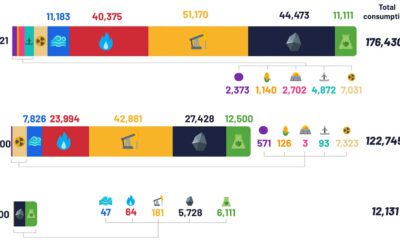

Despite the advent of renewable sources of energy, fossil fuels and their carbon emissions, haven’t gone anywhere.


 Creator Program