

Asia dominates this ranking of the world's largest EV battery manufacturers in 2023.


Lithium-ion batteries are critical for many modern technologies, from smartphones to smart cities. Here's how this critical technology works.
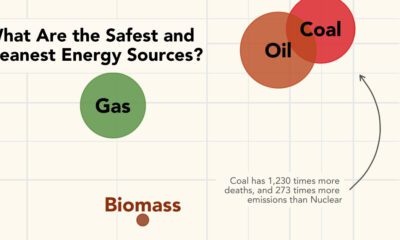

What are the safest energy sources? This graphic shows both GHG emissions and accidental deaths caused by different energy sources.
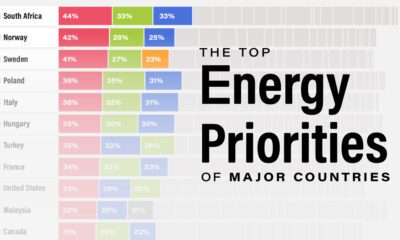

This infographic lists the top energy priorities in 28 countries, based on an Ipsos survey involving 24,000 people.
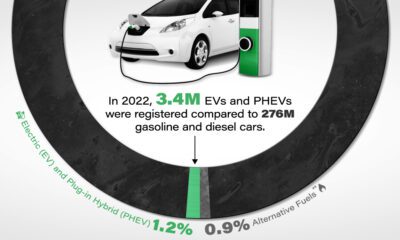

Although sales have been climbing, EV market share in the U.S. remains low as a percentage of all vehicles registered on the road.


In this graphic, we break down where the $400 billion lithium battery industry will generate revenue in 2030.


In this graphic, we visualize whether major electricity-consuming countries are on track to meet their 2030 renewable energy targets.
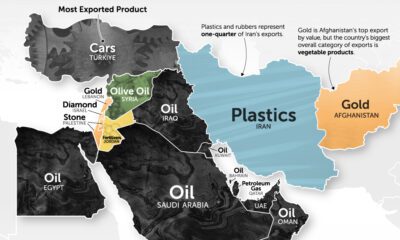

It's more than just oil. This map of Middle East exports shows the top global product of each country by value.
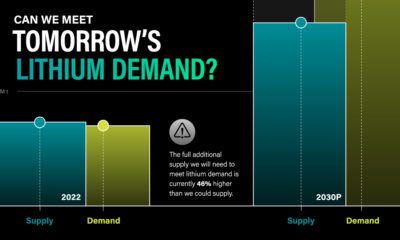

This graphic shows that demand for lithium will outstrip supply by 46%. But direct lithium extraction could be a solution to this problem.


Gas prices fluctuate from state to state due to factors such as local taxes, environmental regulations, and the proximity of refineries.


The cost of electric vehicle batteries can vary based on size and chemical composition. Here are the battery costs of six popular EV models.