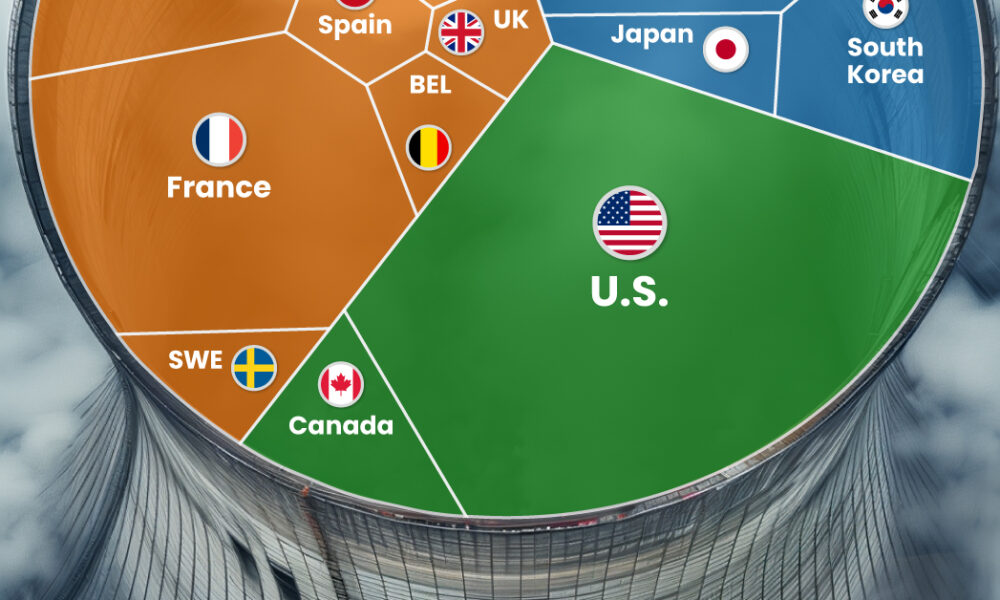
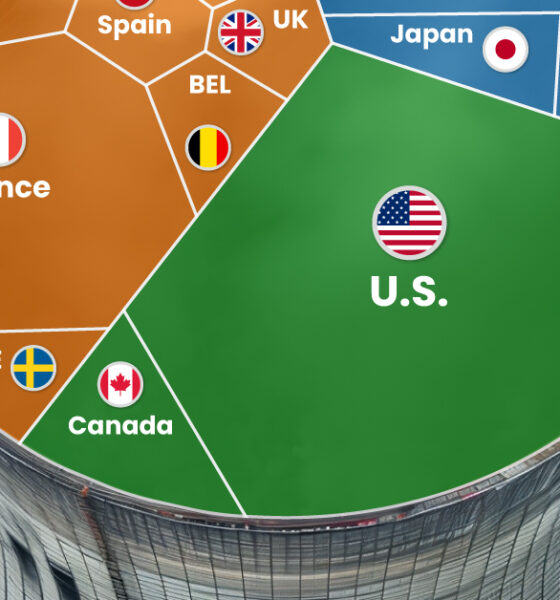
China has grown its nuclear capacity over the last decade, now ranking second on the list of top nuclear energy...
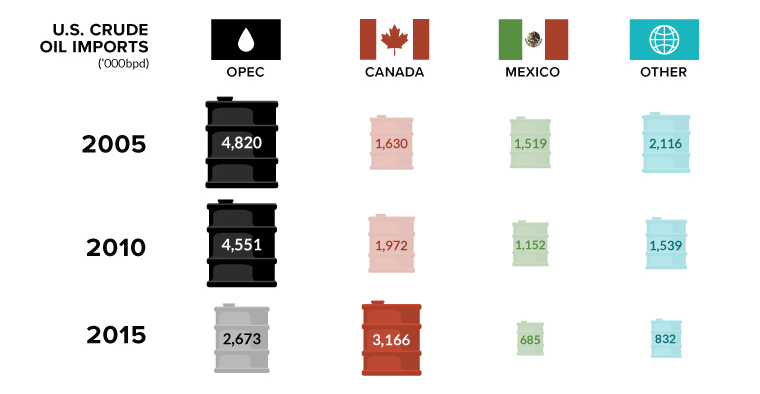
Canada is in, and OPEC is out. In this week's chart on oil imports, we also look at the declining influence of the world's most infamous...
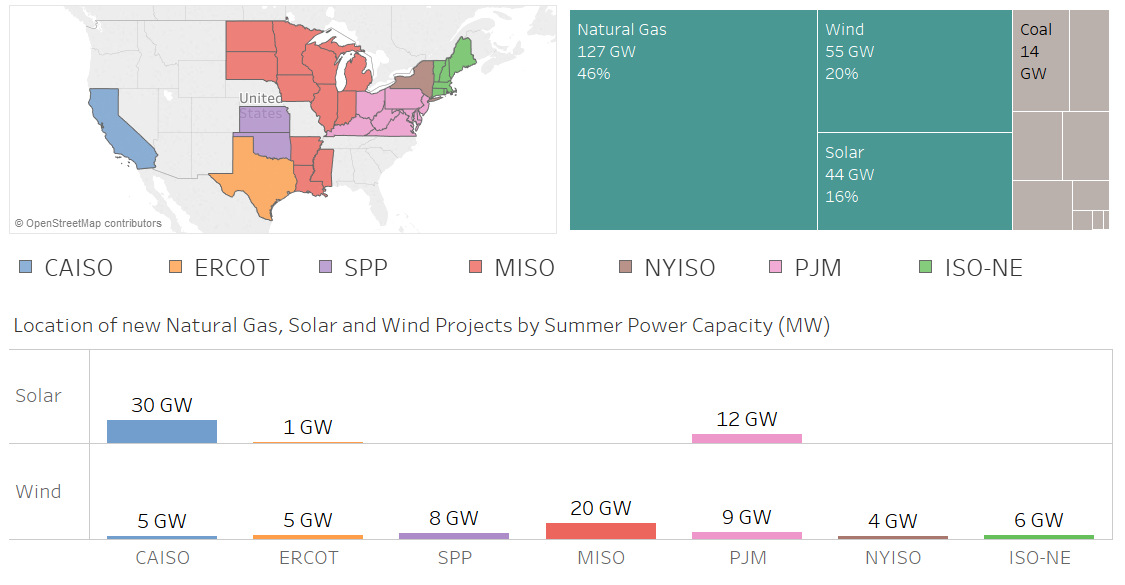
Nearly 100 GW of new power coming online is from solar and wind, making up 36% of new electrical capacity being added in these jurisdictions.
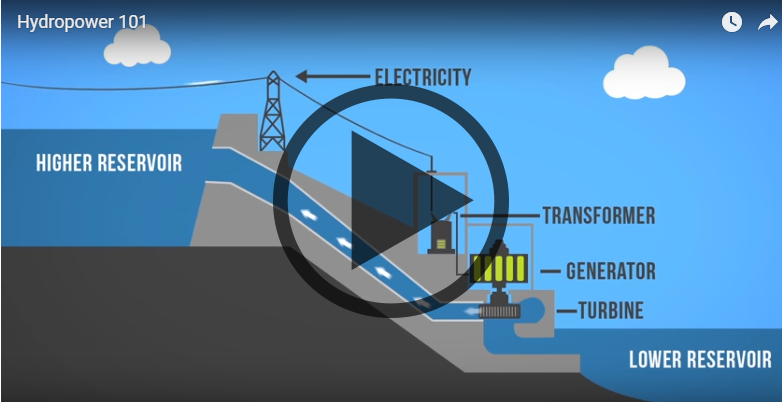
Want to learn about how different energy sources work? Check out these short, fact-driven videos on topics like oil, hydro, solar, wind, LNG, or fracking.
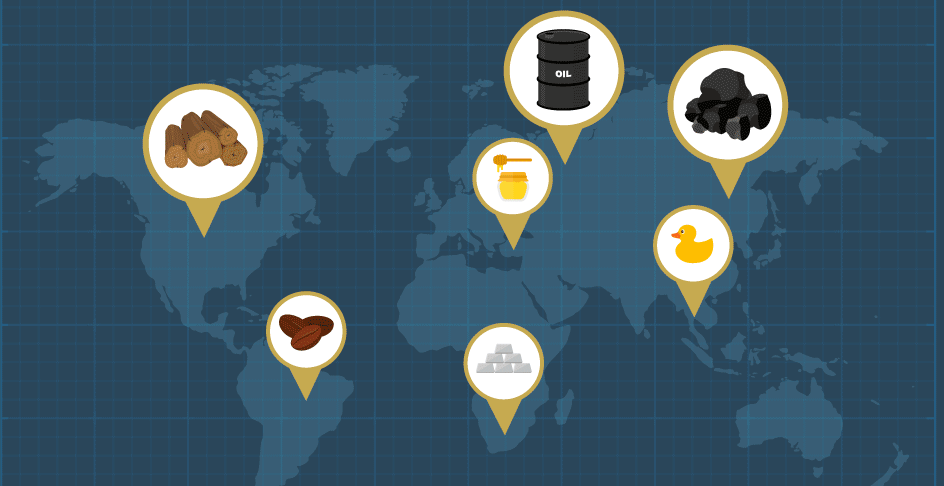
Every “thing” comes from somewhere. Whether we are talking about an iPhone or a battery, even the most complex technological device is made up of the...
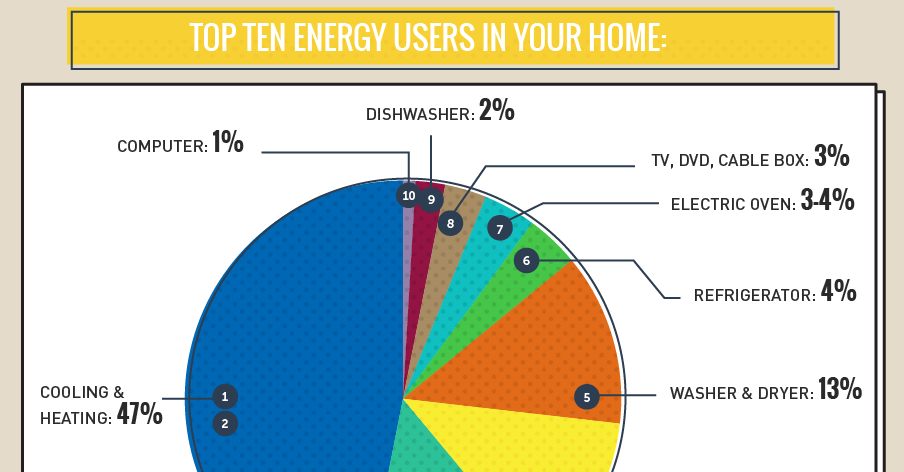
The average U.S. household spends $1,368 per year on energy, and a whopping 35% of that is wasted by appliances. See what uses the most energy...
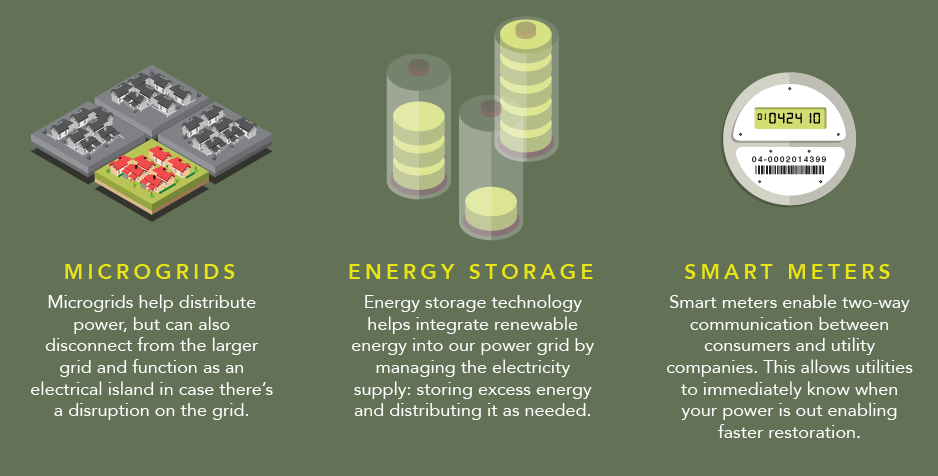
How does electricity to your home? This infographic shows how the power grid works, along with the brand new innovations coming to a grid near you.
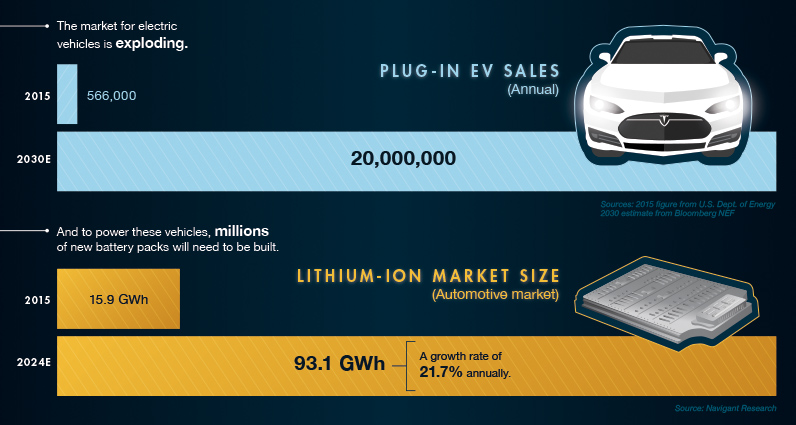
The explosion in demand for electric cars means we need more batteries. But where do the raw materials of batteries come from, and do we have...
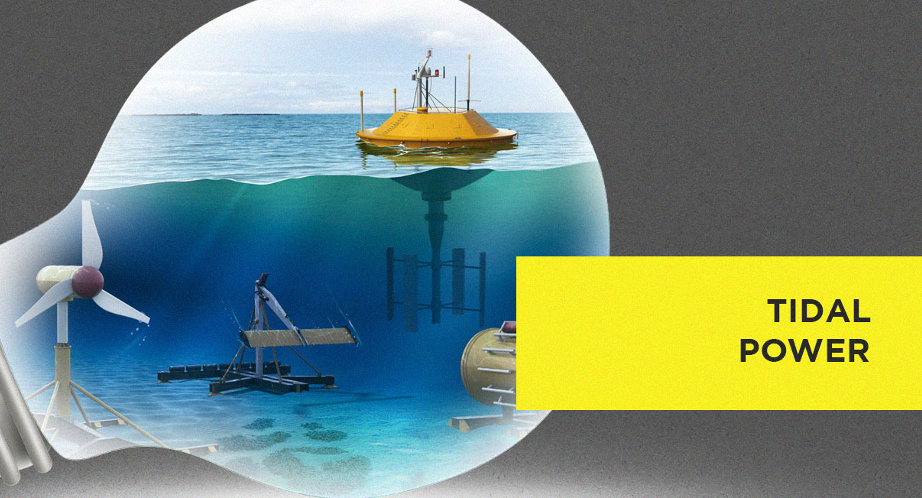
Which new sources of energy have promise? This infographic highlights the upcoming technologies that may provide the alternative energy sources of the future.
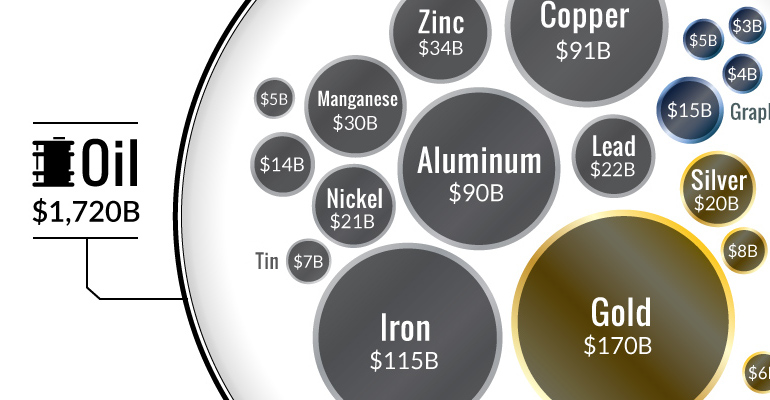
Ever wonder why the oil industry has so much influence? This chart shows that all metal markets combined don't even come close to touching the oil...
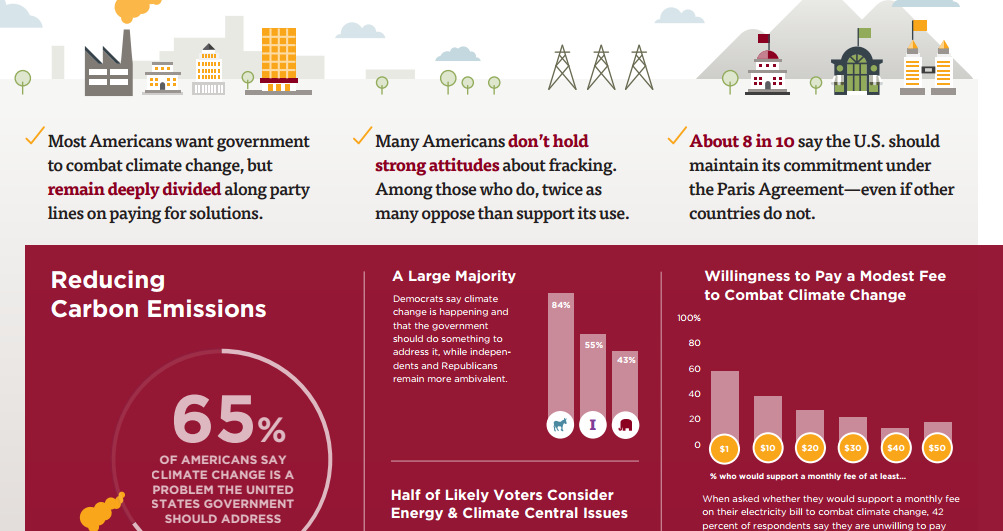
This survey of over 1,000 Americans tells you what people actually believe about fracking, coal, climate change, and other hot button energy issues in the U.S.


