
China has grown its nuclear capacity over the last decade, now ranking second on the list of top nuclear energy...
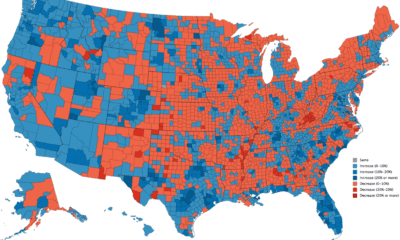

Rural counties across the U.S. are losing residents as large cities and the coasts are growing. This map shows U.S. population change by county.

See every major coal power plant ever commissioned on this animation, which covers a time period from 1927 until 2019.
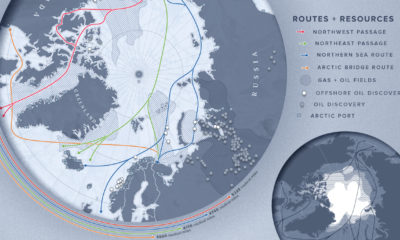

As the Arctic becomes more accessible due to reduced ice cover, countries with polar real estate increasingly viewing the region through an economic lens.
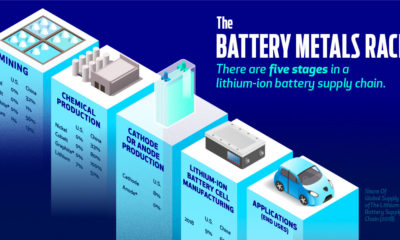

Is the U.S. positioned to win the battery arms race, or will China remain in control of the world's transition to renewable energy?
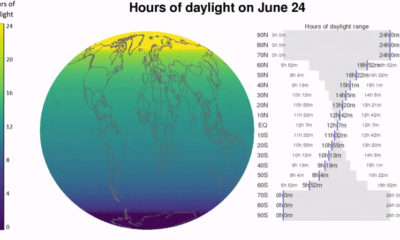

The length of your days can change depending on the seasons, and where you are on Earth. Watch how these patterns unfold over a year.
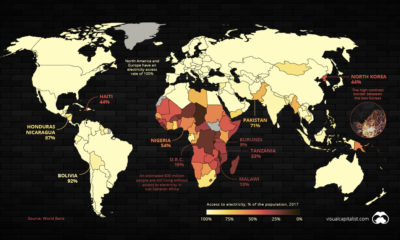

A surprising number of people around the world are still living without access to reliable electricity. This map shows where they live.
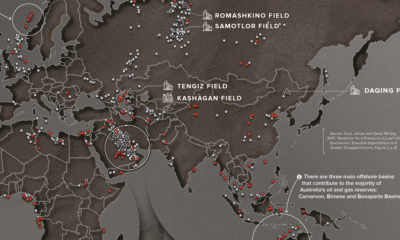

Since 1868, there had been 1,232 oil discoveries over 500 million barrels of oil. This map plots these discoveries to reveal global energy hot spots.
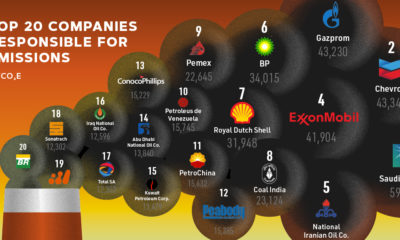

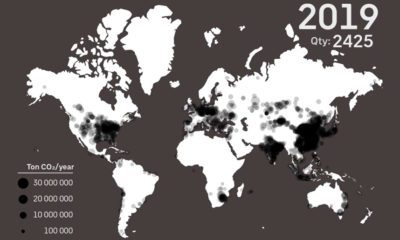
Since 1965, over ⅓ of the world’s cumulative carbon emissions can be traced back to just 20 fossil fuel companies. Who are the biggest contributors?
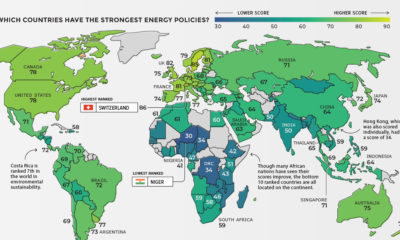

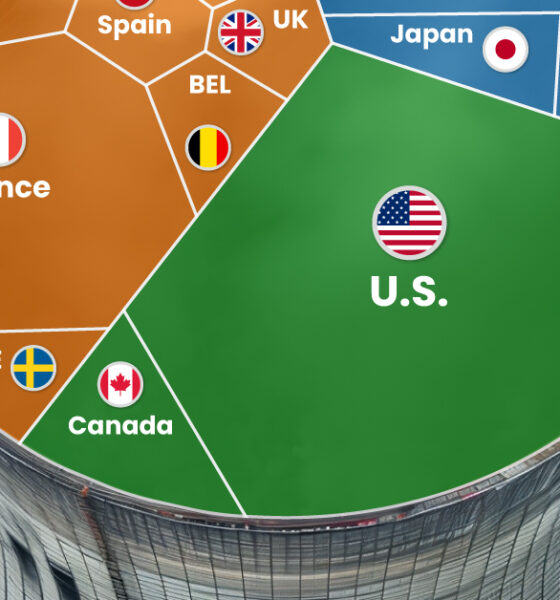
Which countries are able to balance prosperity and sustainability in their energy mixes? See the countries with the most sustainable energy policies.
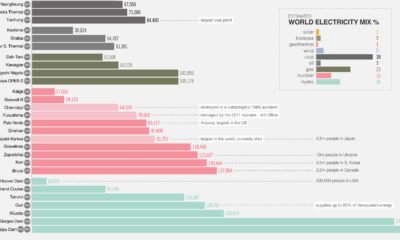

As global population grows, our energy demand grows as well. Here are the largest energy sources in the world and how much electricity they generate.


