

Asia dominates this ranking of the world's largest EV battery manufacturers in 2023.
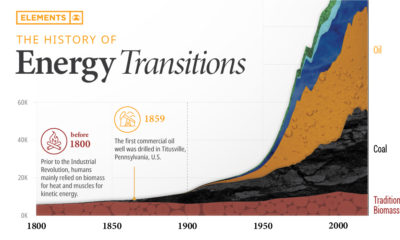

The current energy transition is unprecedented in both scale and speed. This infographic puts it into historical context.
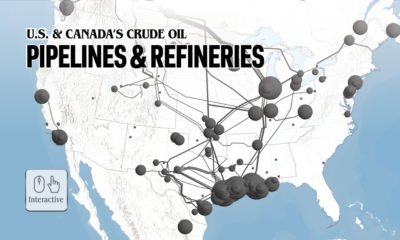

Explore North America's crude oil pipelines and refineries across the U.S. and Canada in our interactive map.
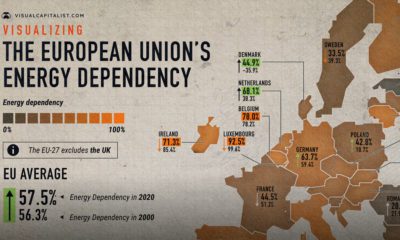

The EU's energy dependency has become a major issue amid Russia's invasion of Ukraine. See what the data says in this infographic.
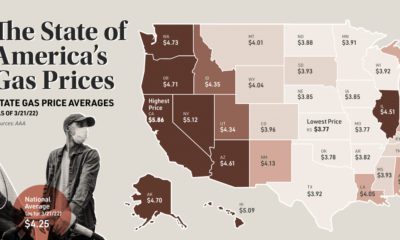

This map looks at gas prices across various states, and historical context for today's sky-high prices at the pump.
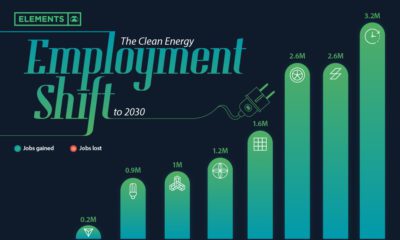

Will the clean energy transition create jobs, or will jobs be lost? Here is projected employment growth in clean energy and related sectors to 2030.
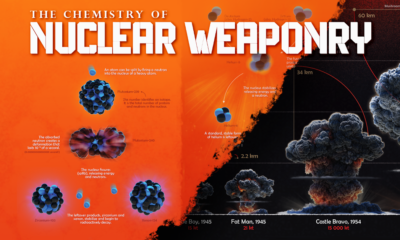

Nuclear weapons have devastating effects, but the science of how they work is atomically small. So, how do nuclear weapons work?
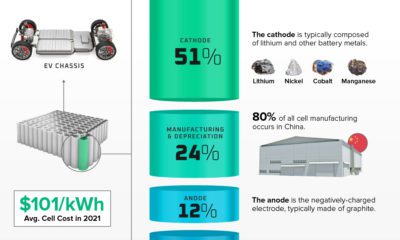

The average cost of EV batteries has fallen by 89% since 2010. What makes up the cost of a single EV battery cell?
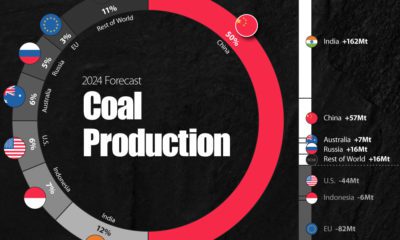

Coal came under scrutiny for its high carbon emissions at COP26, but many countries are forecasted to increase coal production until 2024.
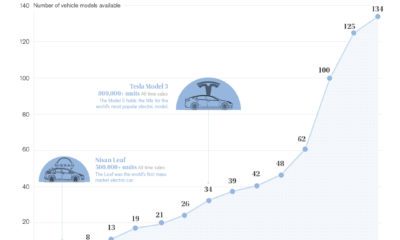

As legacy automakers transition to full electric, buyers in the U.S. can expect a wave of new EV models to arrive soon.
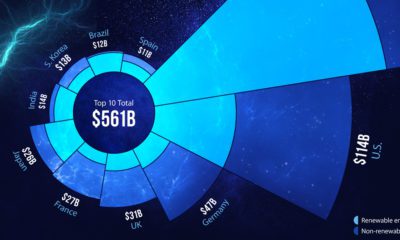

Global energy transition investment hit $755 billion in 2021. This chart ranks the top 10 countries by energy transition investment.