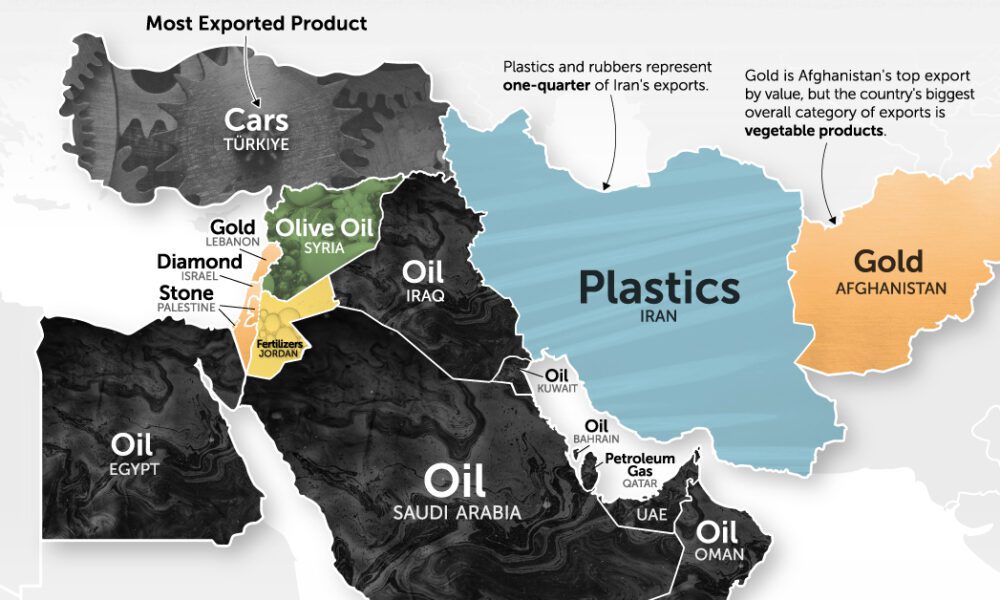
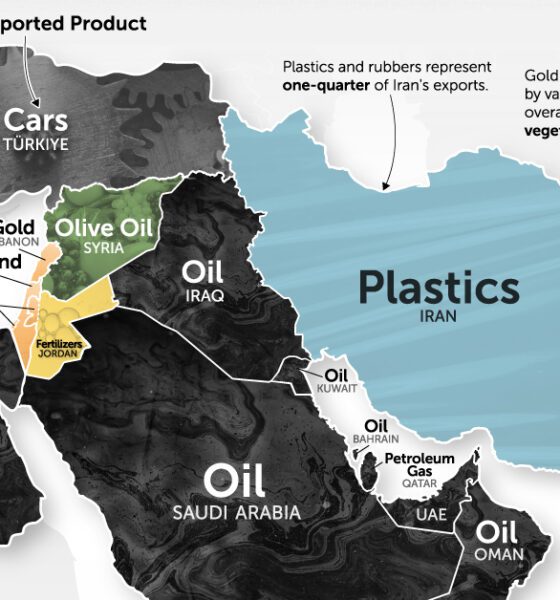
It's more than just oil. This map of Middle East exports shows the top global product of each country by...
Looking back on 2014, this infographic sums up the major changes occurring in energy markets in oil, renewables, sanctions, and more.
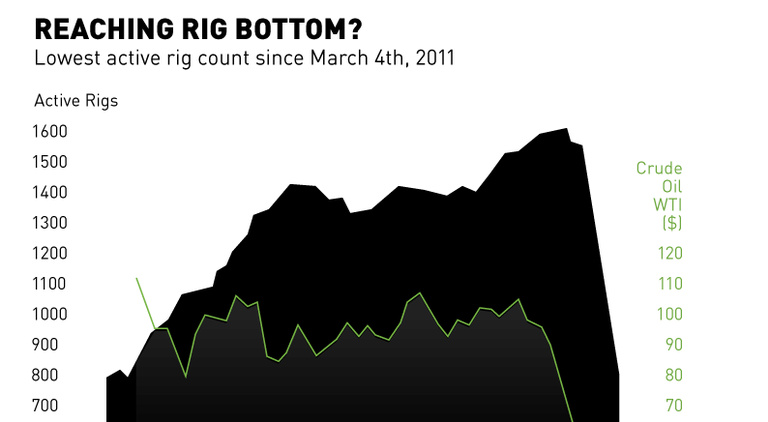
Oil rigs decline for the 17th straight week to 802, as drillers can do more with less. Yet, production is at highs and storage availability is...
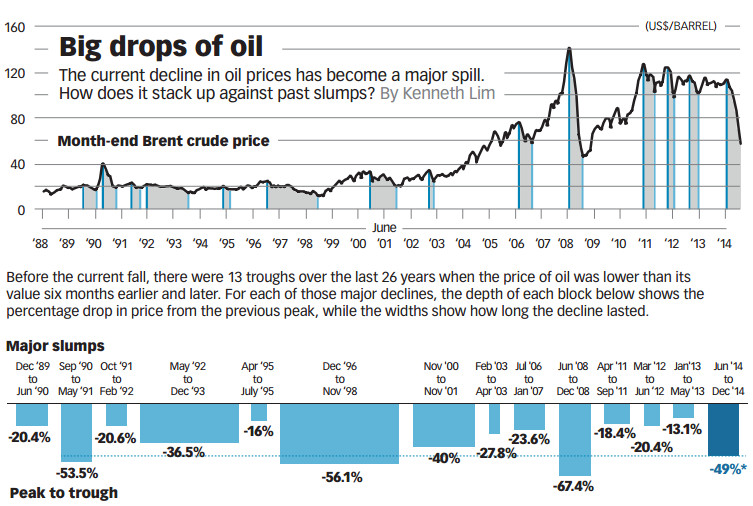
In the last six months of 2014, crude oil dropped 49% in price. How does this compare to other famous oil slumps in history?
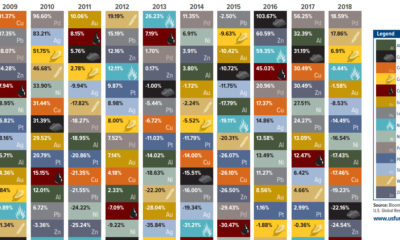

This visualization compares the annual returns of major commodities over the last 10 years including gold, silver, oil, and more.
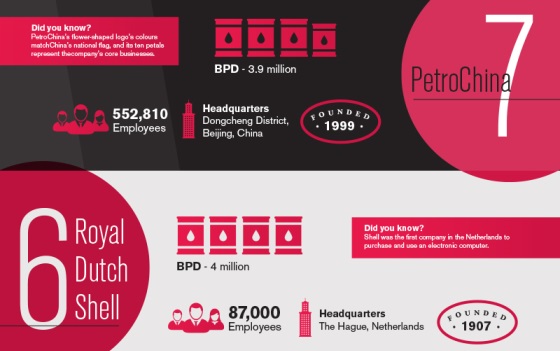
Saudi Aramco, the Saudi Arabian oil and gas giant, is by far the biggest energy company in the world, generating $1 billion in revenue per day.
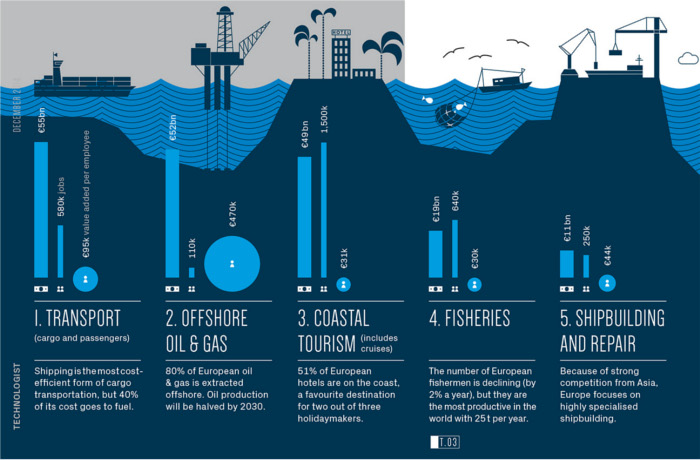
This infographic focuses on Europe, where the United Kingdom is nautical miles ahead of anyone else in terms of developing sea-related industries.
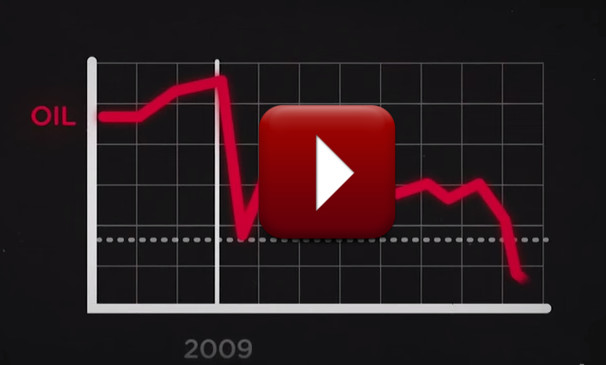
This infographic video shows the story behind oil's plunge through 2014.
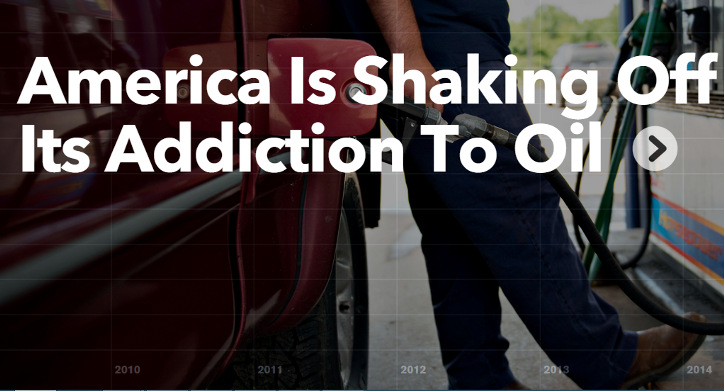
With gas prices as low as they have been since 2010, America's oil addiction is waning.
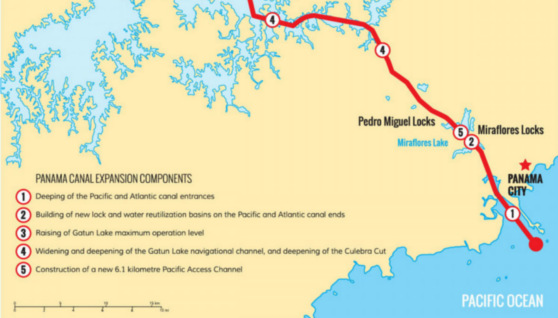
The Panama Canal expansion began in 2007, and will be finally completed next year. Costing $5.25 billion, this project will be a boon to international trade...
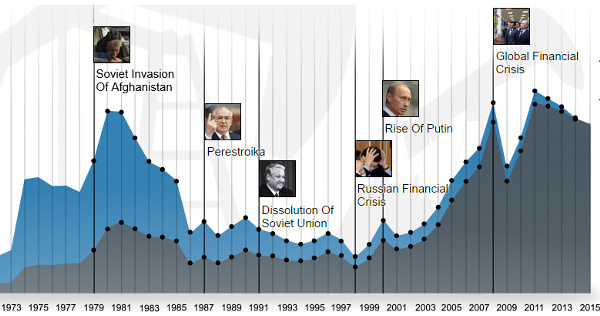
Some countries benefit from having oil as a cheaper input, but Russia is not one of them. Russia is the second largest exporter of oil selling...


