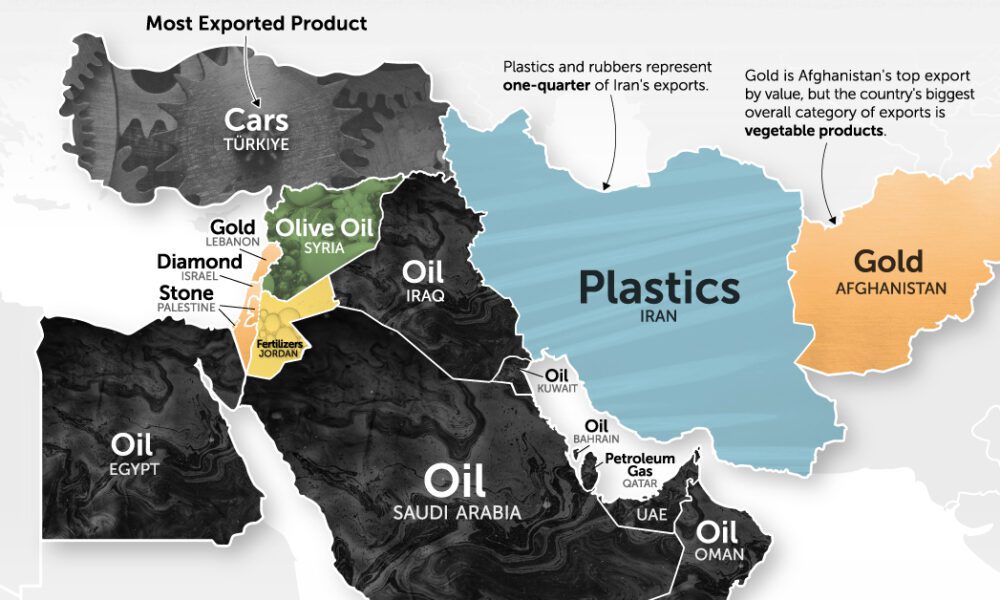
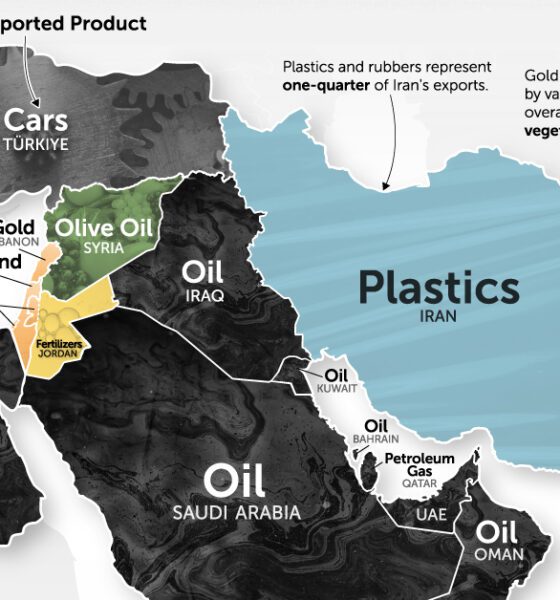
It's more than just oil. This map of Middle East exports shows the top global product of each country by...

Since 1868, there had been 1,232 oil discoveries over 500 million barrels of oil. This map plots these discoveries to reveal global energy hot spots.

Which countries are able to balance prosperity and sustainability in their energy mixes? See the countries with the most sustainable energy policies.
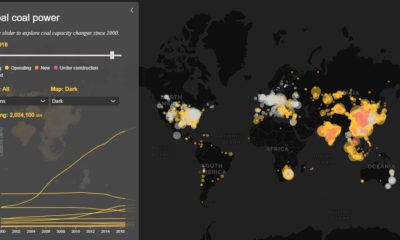

Today’s interactive map shows all of the world's coal power plants, plotted by capacity and carbon emissions from 2000 until 2018.
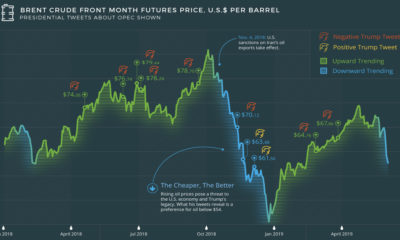

What goes through the head of a U.S. president? The tweets of U.S. President Donald Trump reveal a contentious relationship with the price of oil and...
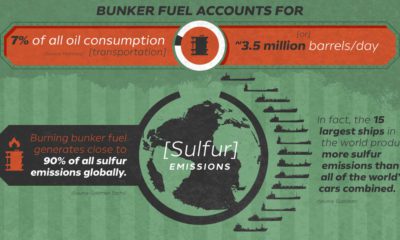

IMO 2020, which sets ambitious emissions limits, is about to shake up maritime shipping. Today's graphic covers the environmental and economic impacts
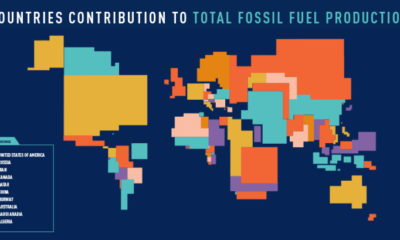

These four animated cartograms show the nations leading the world in fossil fuel production, in terms of oil, gas, coal, and total hydrocarbons.
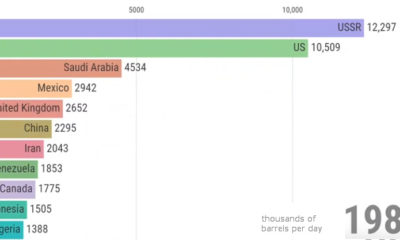

View how the ranking of the world's largest producers of crude oil changes over a 50 year period, from the Cold War until today.


It is counterintuitive, but electric vehicles are not possible without oil - these petrochemicals bring down the weight of cars to make EVs possible.
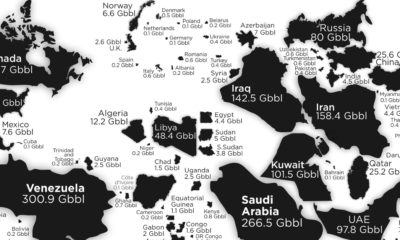

See the countries with the most oil reserves on this map, which resizes each country based on how many barrels of oil are contained in its...
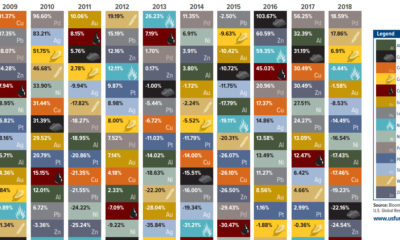

This unique chart shows the performance of individual commodities over the last decade - see commodity returns in 2018, and how they compared to previous years.