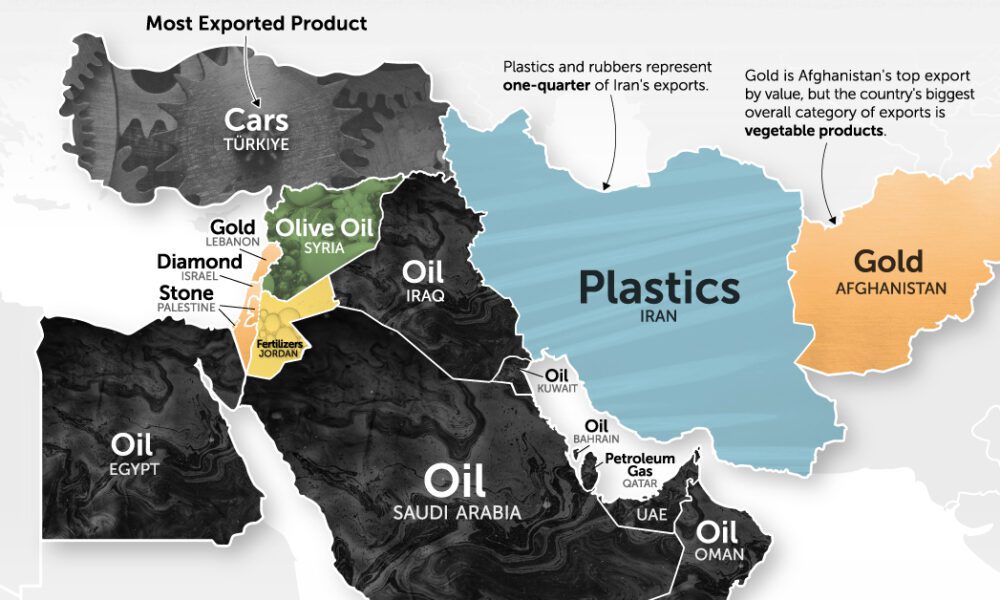
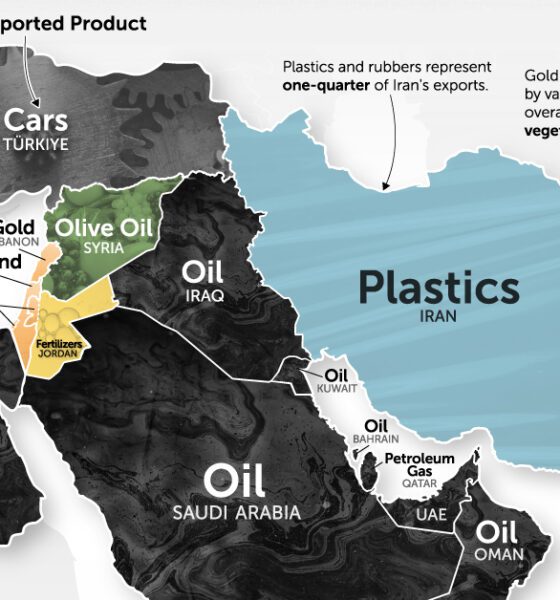
It's more than just oil. This map of Middle East exports shows the top global product of each country by...
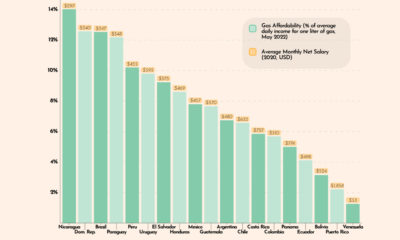

This graphic looks at gas affordability in Latin America, showing how much a liter of gas costs in 19 countries, relative to average incomes.
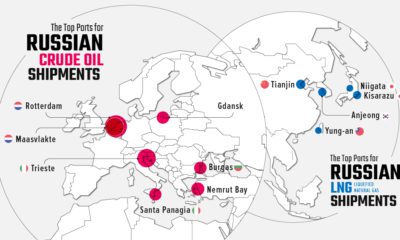

Russia's energy exports have become a hot topic. See which ports received fossil shipments during the first 100 days of the Ukraine invasion
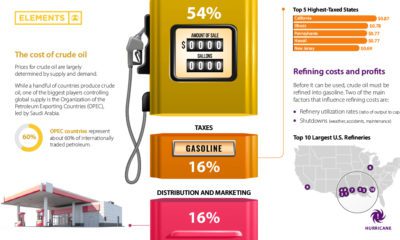

Gasoline prices across the U.S. have reached record-highs. Why? This graphic helps explain what factors influence the cost of gasoline.
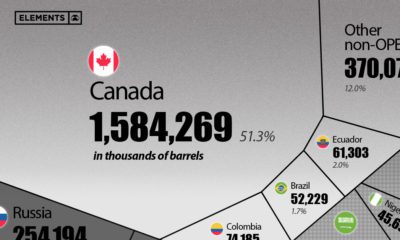

This visualization breaks down U.S. oil imports by country for 2021, showing the split by OPEC and non-OPEC nations.
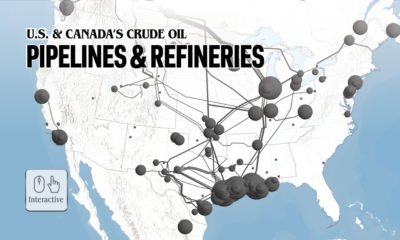

Explore North America's crude oil pipelines and refineries across the U.S. and Canada in our interactive map.
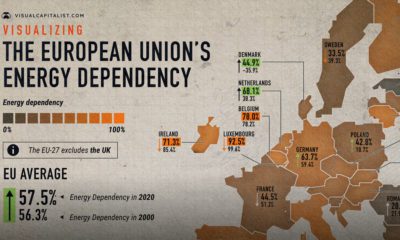

The EU's energy dependency has become a major issue amid Russia's invasion of Ukraine. See what the data says in this infographic.
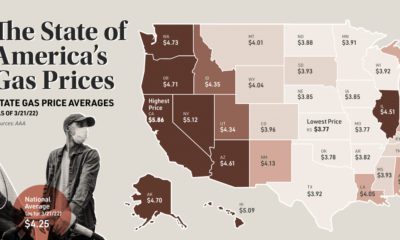

This map looks at gas prices across various states, and historical context for today's sky-high prices at the pump.
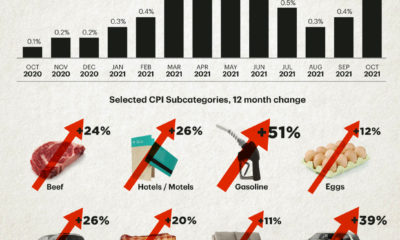

The U.S. inflation rate has seen its fastest annual increase in over 30 years. Which consumer spending categories have been hit the hardest?
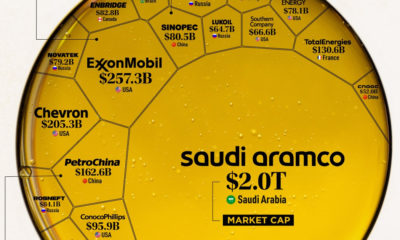

Oil still makes up the largest share of the global energy mix. Here are the largest oil and gas companies by market cap in 2021.
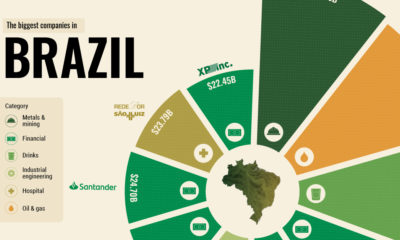

What drives some of the world’s emerging economies? From natural resources to giant banks, here are the top 10 biggest companies in Brazil.


 Creator Program