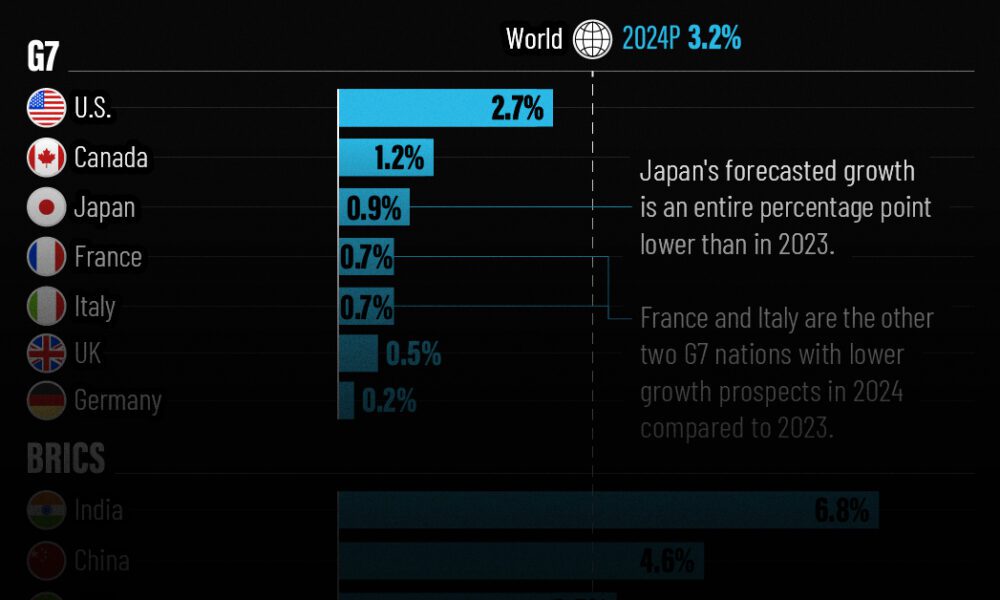
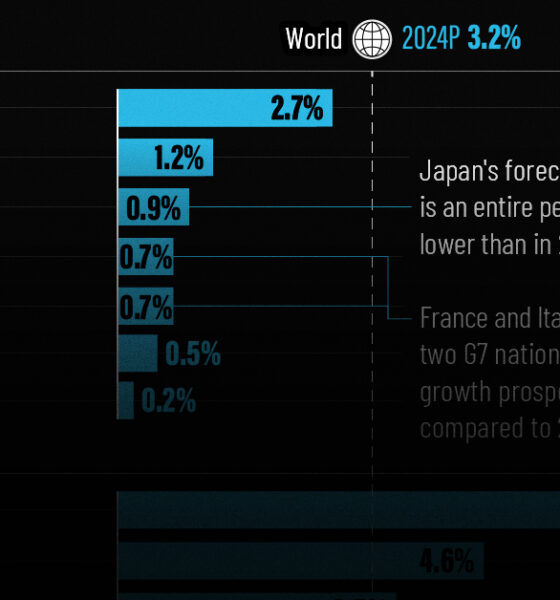
The IMF has released its economic growth forecasts for 2024. How do the G7 and BRICS countries compare?
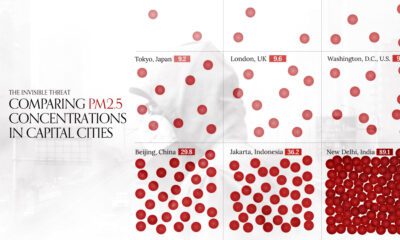

This visual compares air quality in 50 capital cities around the world by average PM2.5 concentrations in 2022.
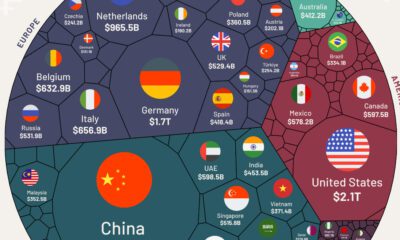

We visualize nearly $25 trillion of global exports by country, showing you the top exporting nations and the data behind it all.


Some jobs need a degree, while others don’t. Here are the top 20 most sought-after entry level jobs with and without a degree.
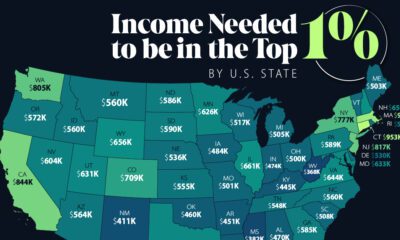

An annual income anywhere between $360,000-$950,000 can grant entry into the top 1%—depending on where you live in America.
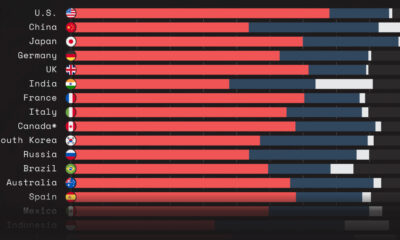

This graphic shows GDP by country, broken down into three main sectors: services, industry, and agriculture.


Considering factors like the cost of investment and number of locations, this graphic breaks down the best franchises in the U.S.
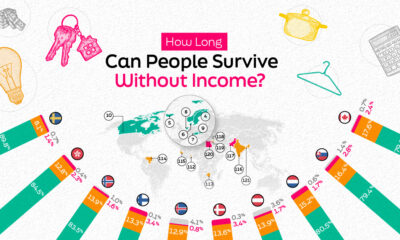

Income security is critical in resilience. In this graphic, we explore how secure people are and how long they could live without income.
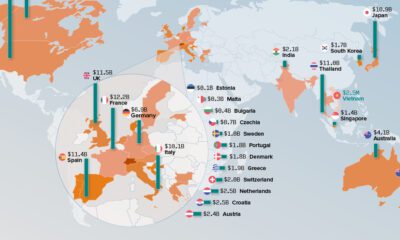

Between 2019 and 2021, consumers enjoyed over $158 billion in combined savings because of the economic impact of online travel agencies.
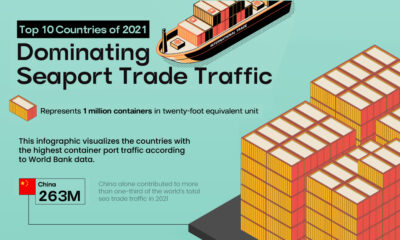

This infographic highlights the countries with the highest container traffic across their ports, thus dominating seaport trade in 2021.
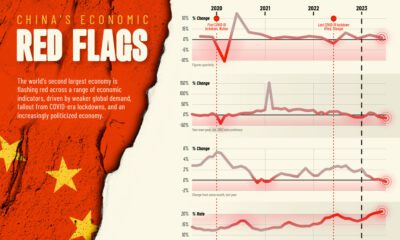

We chart six red flag indicators threatening China's economy and it's post-pandemic recovery, as well as global economic growth


 Creator Program