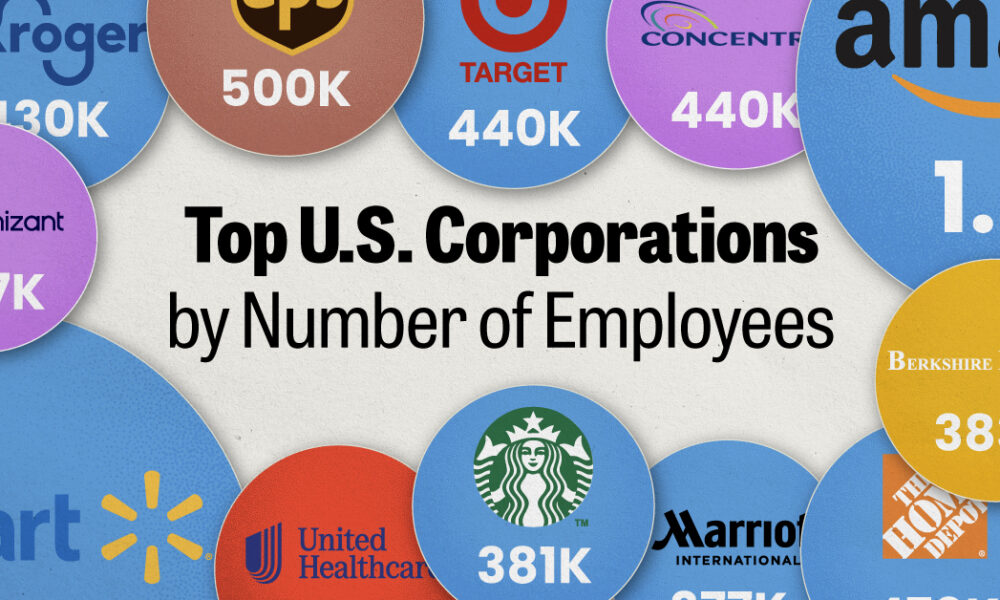
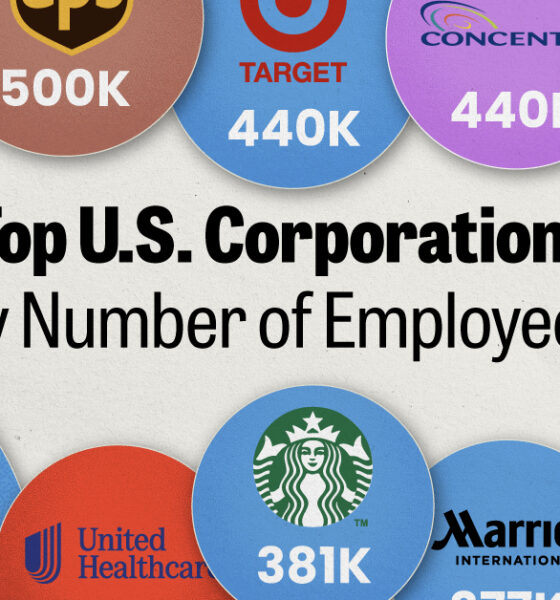
We visualized the top U.S. companies by employees, revealing the massive scale of retailers like Walmart, Target, and Home Depot.
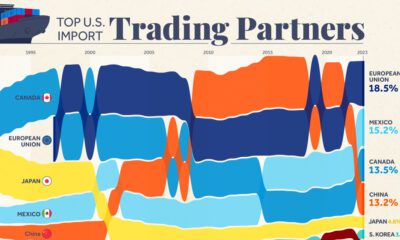

Nearly 60% of U.S. imports came from just four trade entities in 2023. We rank the top U.S. trading partners and show their growth over time.
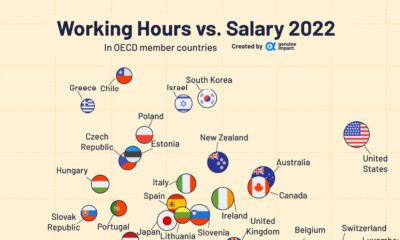

What are the average work hours and salaries in OECD countries? We look at the data for trends across regions.
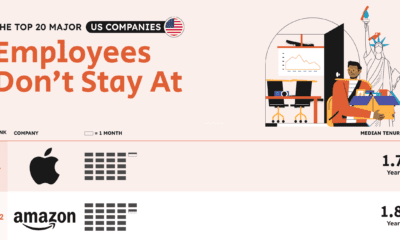

Top tech giants such as Apple, Amazon, and Meta lead the list of companies with the worst employee retention in the U.S.
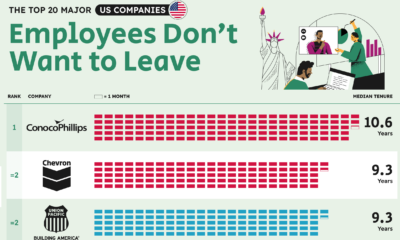

Which companies excel in employee retention? Here are the companies that have the longest tenured employees in both the U.S. and UK.
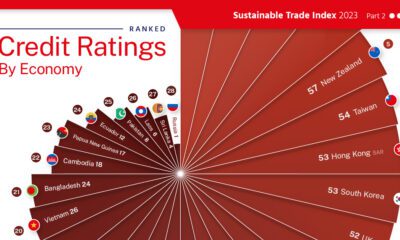

This graphic visualizes 30 country's credit ratings, using data from the 2023 Sustainable Trade Index.


More than 45 million American residents were immigrants in 2021, having moved for various reasons.
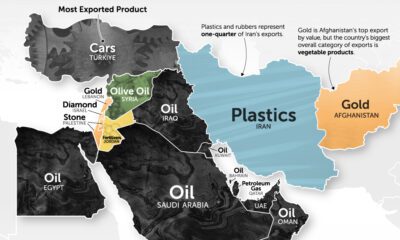

It's more than just oil. This map of Middle East exports shows the top global product of each country by value.
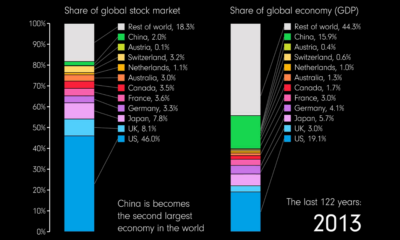

This animation compares countries' share of the global stock market and GDP over 122 years from 1900 to 2022.
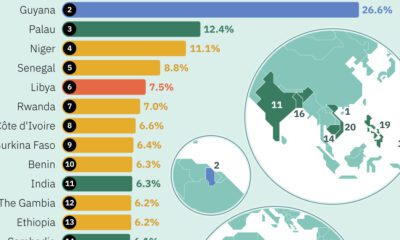

This graphic uses the latest IMF projections to rank the world's top 20 fastest growing economies for 2024.
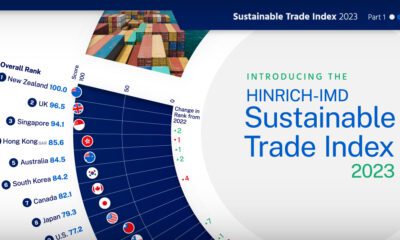

The Sustainable Trade Index 2023 is an annual ranking of the world's most sustainable economies. View this infographic to see the results.


 Creator Program