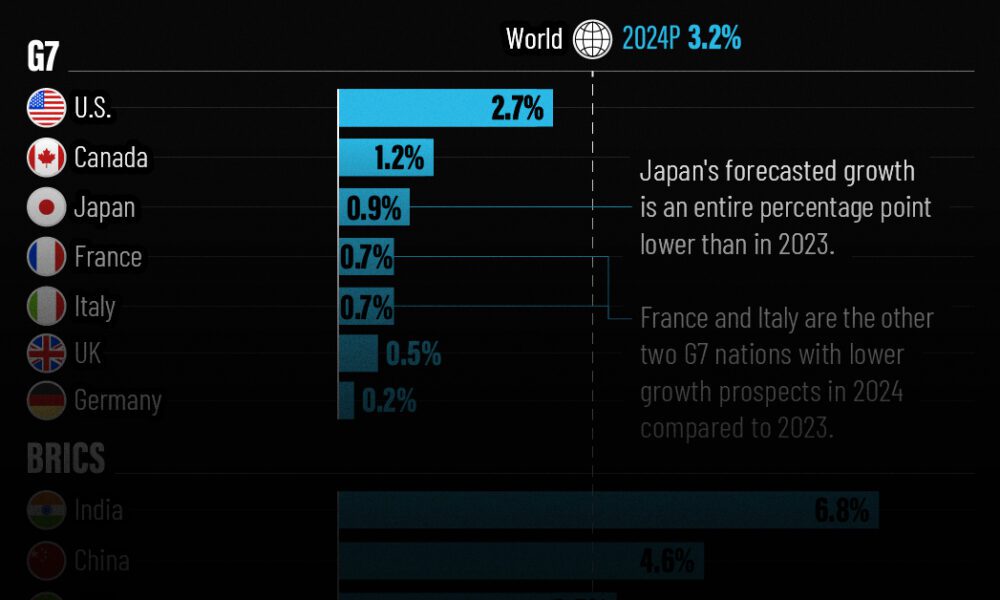
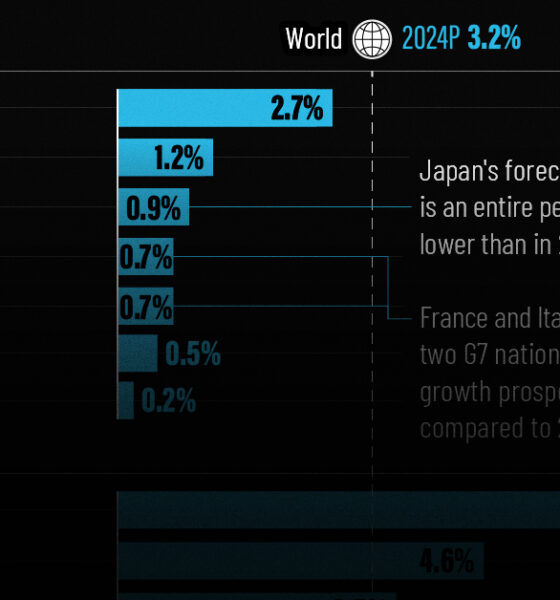
The IMF has released its economic growth forecasts for 2024. How do the G7 and BRICS countries compare?
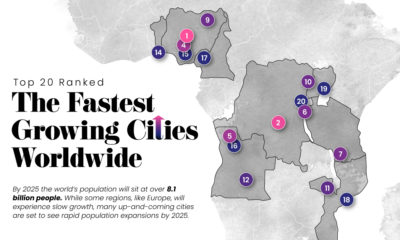

Nearly 60% of the world's population lives in cities and this trend is not slowing down—take a look at the world's 20 fastest growing cities.
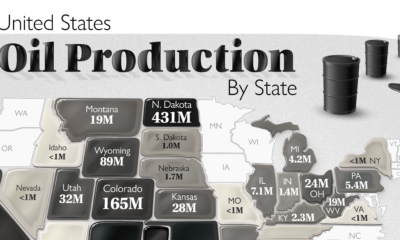

The U.S. is the largest oil producer in the world. Here we map the share of oil production in the country by all 50 states in...
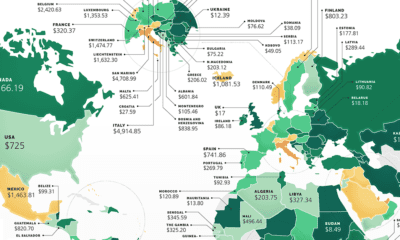

These maps show the most (and least) costly countries for starting a business by relative costs.
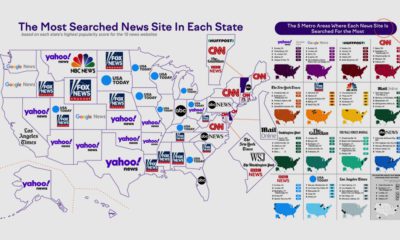

American states have some key differences for their favorite news sites. Here's how they rank by monthly visitors and state popularity.
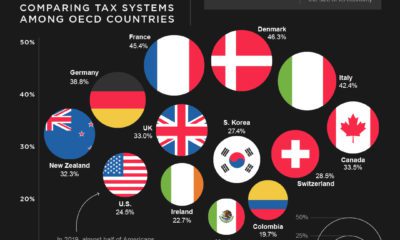

Using the tax-to-GDP ratio, we compare the tax systems of 35 OECD countries. See which nations have the highest and lowest rates.
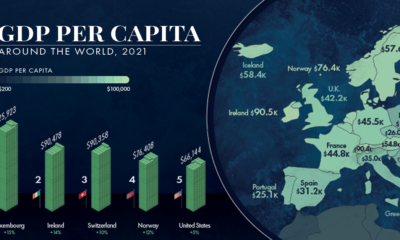

GDP per capita is one of the best measures of a country's standard of living. This map showcases the GDP per capita in every country globally.
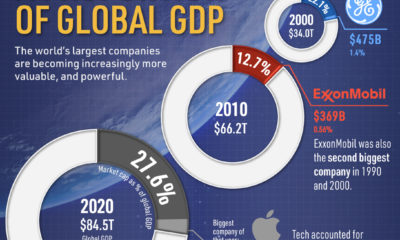

The world's top 50 companies are becoming more valuable, especially compared to global GDP.
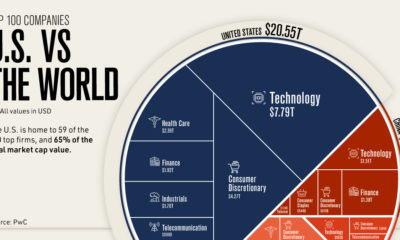

Where are the top 100 companies of the world located? We highlight the U.S. share of the top companies by market capitalization .
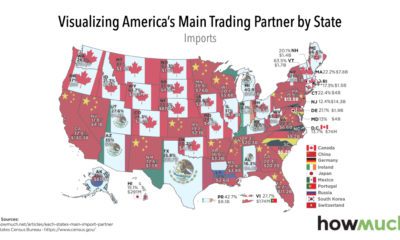

At the national level, Canada and China are top U.S. trading partners. While this generally extends to the state level, there are some surprises too.
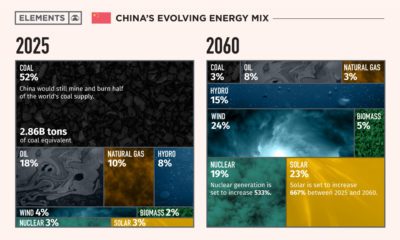

This infographic takes a look at what China's energy transition plans are to make its energy mix carbon neutral by 2060.


