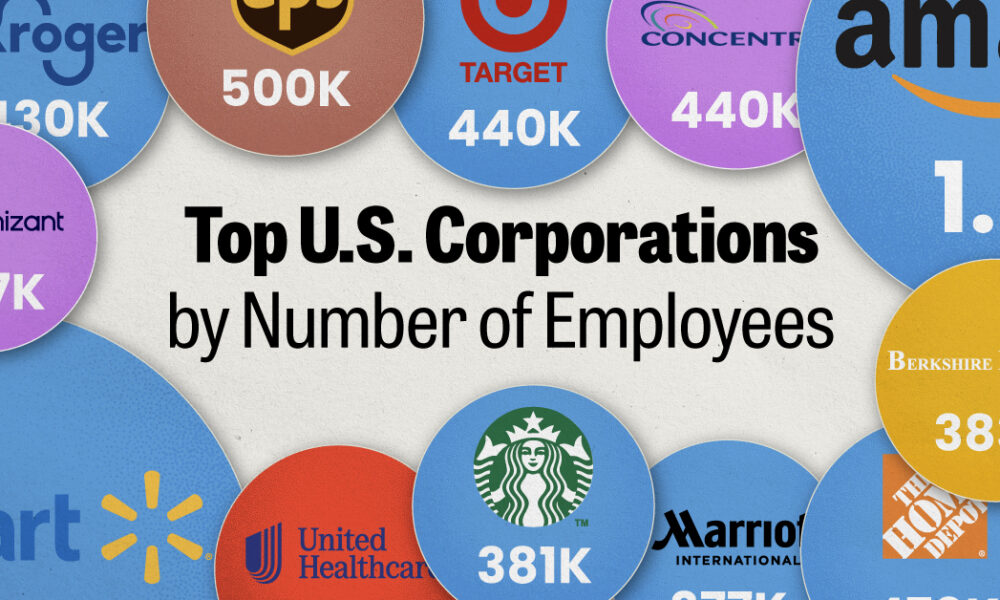
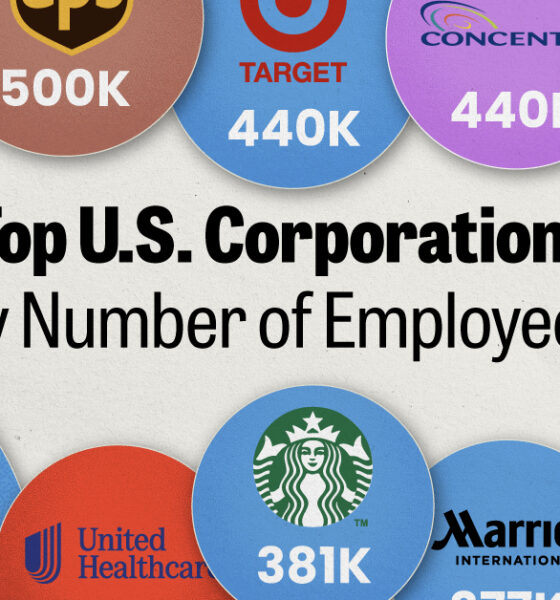
We visualized the top U.S. companies by employees, revealing the massive scale of retailers like Walmart, Target, and Home Depot.


From Fords in the Midwest to Toyotas on the coasts, here are the best selling vehicles in America, visualized by state.
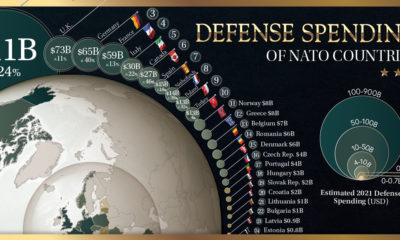

How much does each country in the military alliance contribute to NATO defense spending? We break it down with this map.
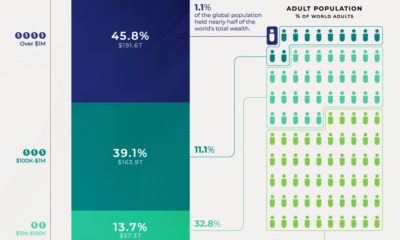

Global wealth at the end of 2020 was about $418 trillion. Here's a breakdown of the global wealth distribution among the adult population.
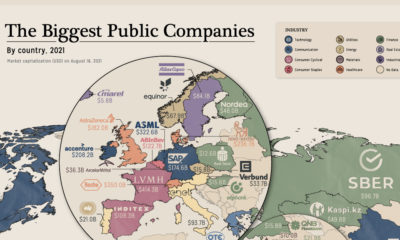

Tech, finance or energy giant? We mapped the biggest companies by market cap and industry.
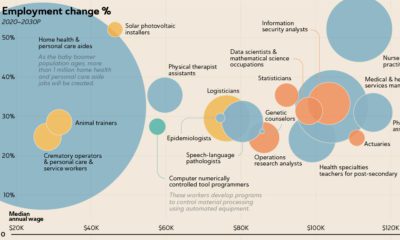

The U.S. Bureau of Labor Statistics predicts an overall job growth rate of 7.7%. Here, we show the fastest growing jobs and how much they pay.


This timeline visualization is a high-level record of what happened on the fateful morning of September 11, 2001
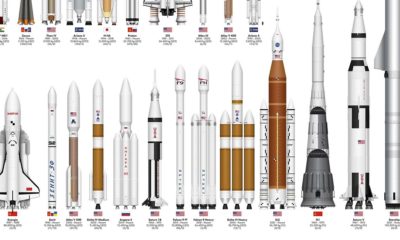

This infographic sizes up different rockets used to explore space, from the USSR's Soyuz to the SpaceX Starship.
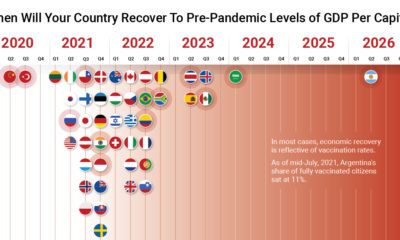

The path to COVID-19 recovery varies worldwide—some countries have already recovered, while others will not be back to normal for years.
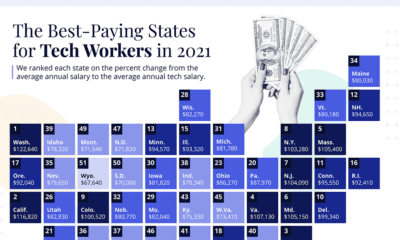

In America, tech jobs pay about 61% more than the average salary. Here's a look at which states have the highest tech salaries.
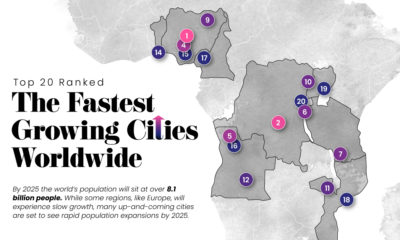

Nearly 60% of the world's population lives in cities and this trend is not slowing down—take a look at the world's 20 fastest growing cities.


