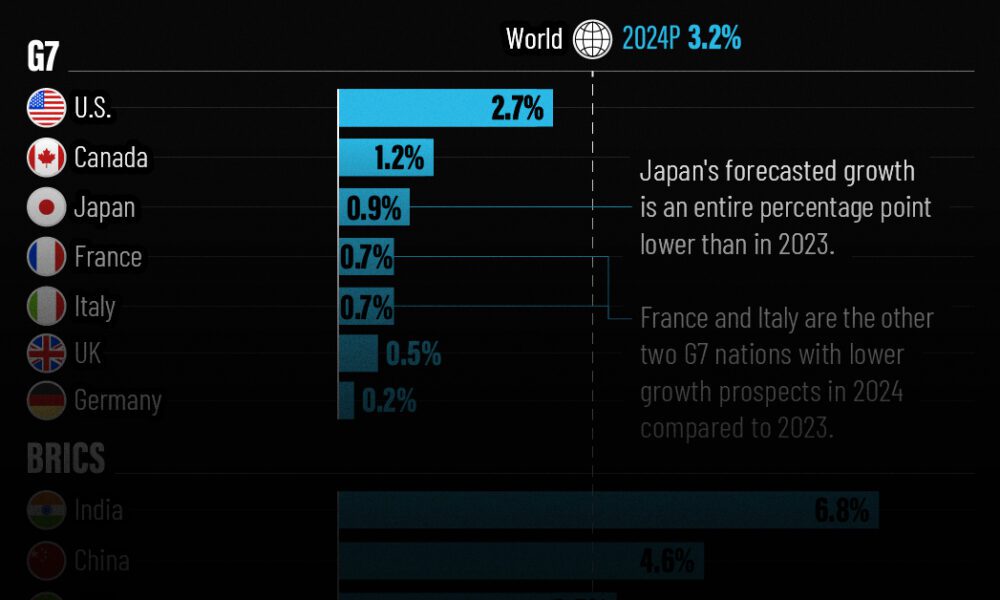
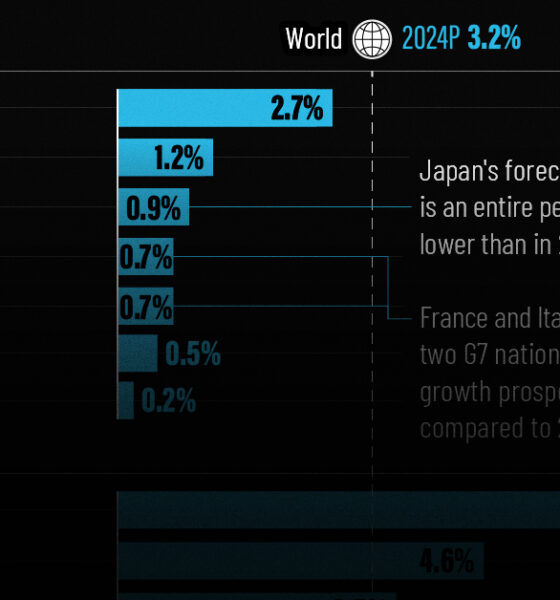
The IMF has released its economic growth forecasts for 2024. How do the G7 and BRICS countries compare?
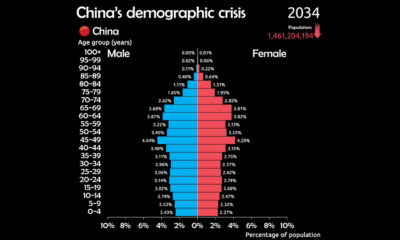

See why China is facing a demographic crisis in this animated chart.
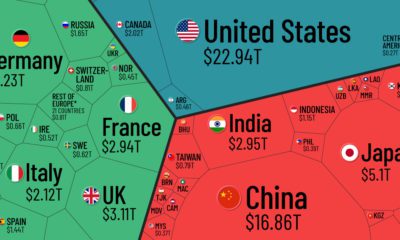

Which countries and regions contribute the most to the world economy? In this infographic, we break down all $94 trillion of global GDP by country.
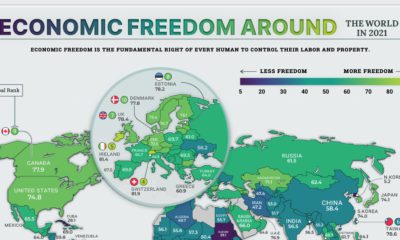

The global average economic freedom score is at the highest its been in 27 years. Here we map the economic freedom score of nearly every country.
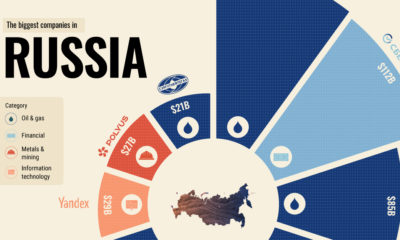

Here are the top 10 biggest companies in Russia, the largest country in the world.
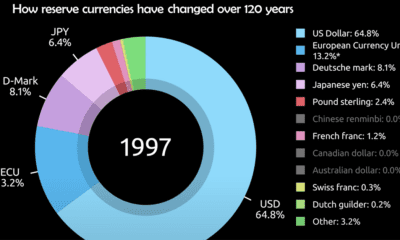

Today, the U.S. dollar makes up 60% of held reserve currency. See how global preferences have shifted since 1900.
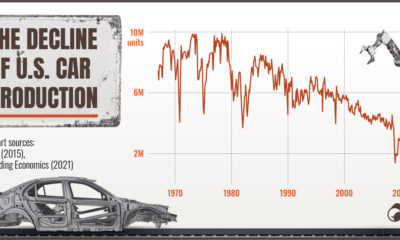

U.S. car production has been in a long-term downward trend since the 1970s. We examine some of the factors driving this trend.
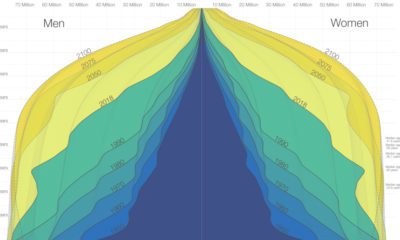

The world is in the midst of a notable demographic transition. Here's how the world population pyramid will change as we close in on the year...
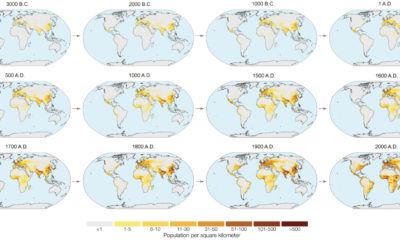

In the next year or so, humanity is expected to pass the 8 billion person milestone. These charts and maps put global population growth into context.
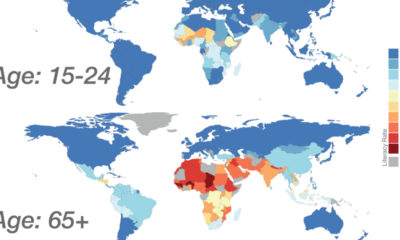

Global literacy mapped by generation, as well as a look at how the data on literacy has changed over time by country.
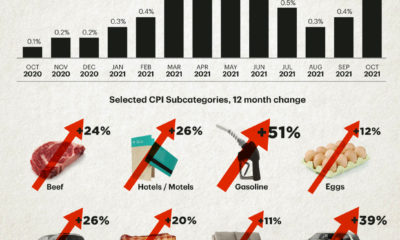

The U.S. inflation rate has seen its fastest annual increase in over 30 years. Which consumer spending categories have been hit the hardest?


 Creator Program