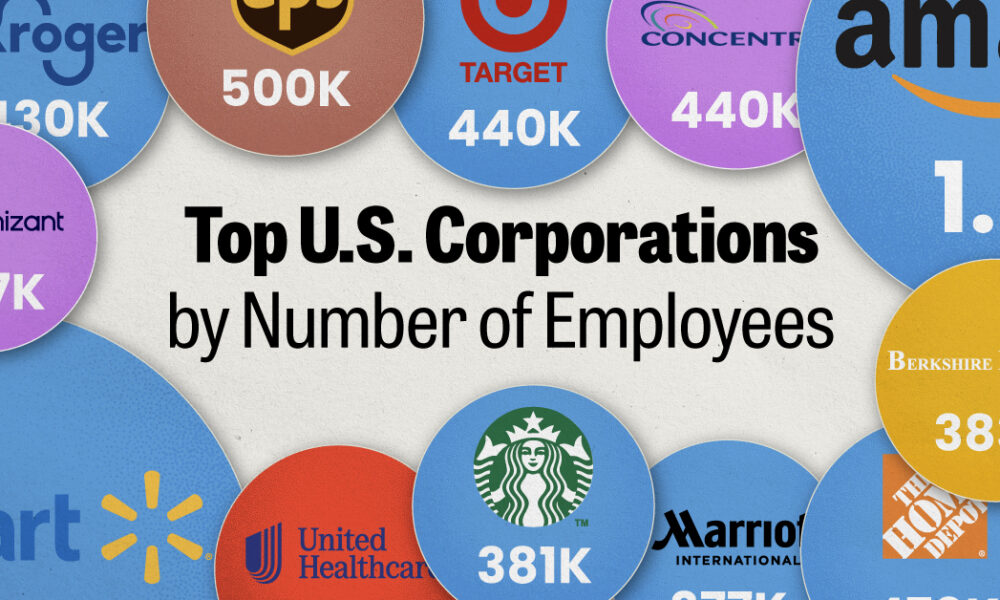

We visualized the top U.S. companies by employees, revealing the massive scale of retailers like Walmart, Target, and Home Depot.
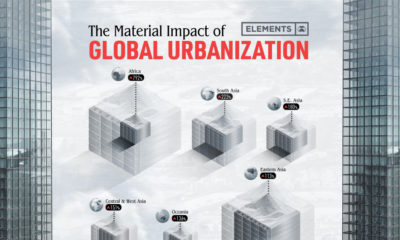

The world’s material consumption is expected to grow from 41 billion tonnes in 2010 to about 89 billion tonnes by 2050. This graphic shows the impact...
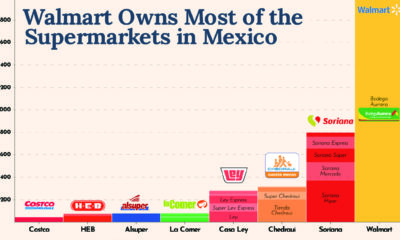

Walmart's presence in Mexico is dominant, with over 2,700 stores. How does their store count compare to companies in the region?
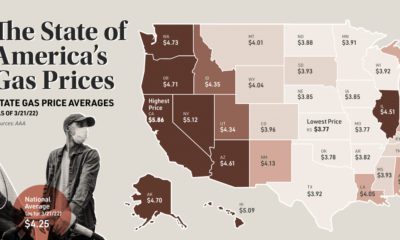

This map looks at gas prices across various states, and historical context for today's sky-high prices at the pump.
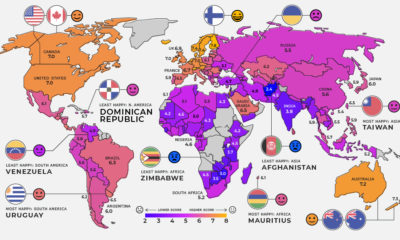

Global happiness levels are determined by several different factors. Here's a look at the happiest and unhappiest countries in every region.


Russia faces a multitude of U.S. sanctions for its participation in global conflicts. This infographic lists who and what has been impacted.
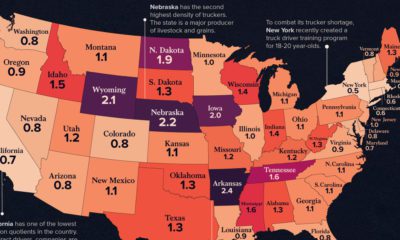

See how America's 1.8 million truckers are distributed across the nation in these two heatmap visualizations.
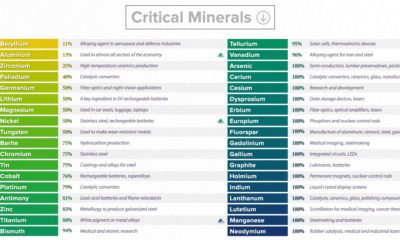

This graphic lists all minerals that are deemed critical to both the economic and national security of the United States.
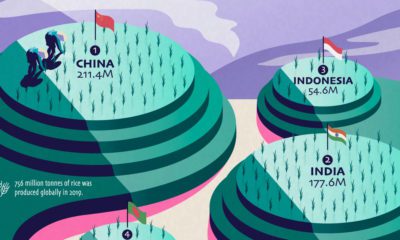

Over half of the world’s population lives on rice as a staple food, but just a few countries dominate global rice production.
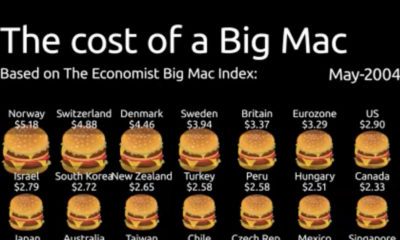

Spanning from 2004-2022, this animation of the Big Mac Index shows the rise in burger prices, and which currencies may be under or overvalued.
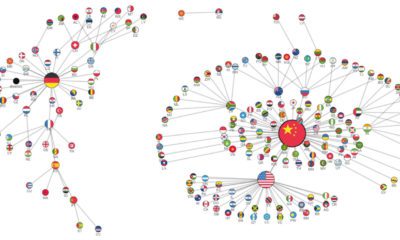

International trade has evolved drastically over the years. While China dominates now, the landscape was much different a few decades ago.


 Creator Program