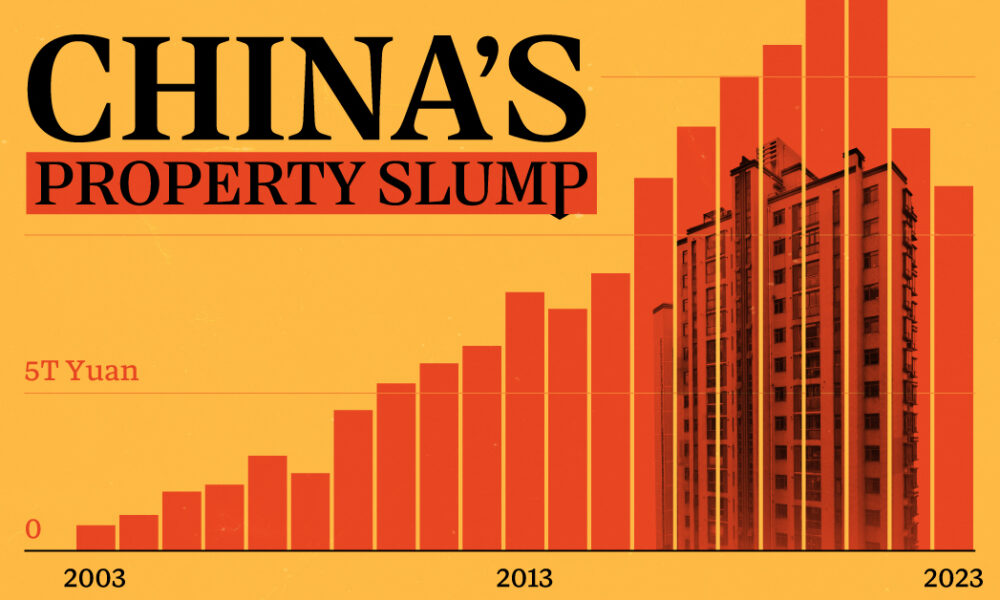
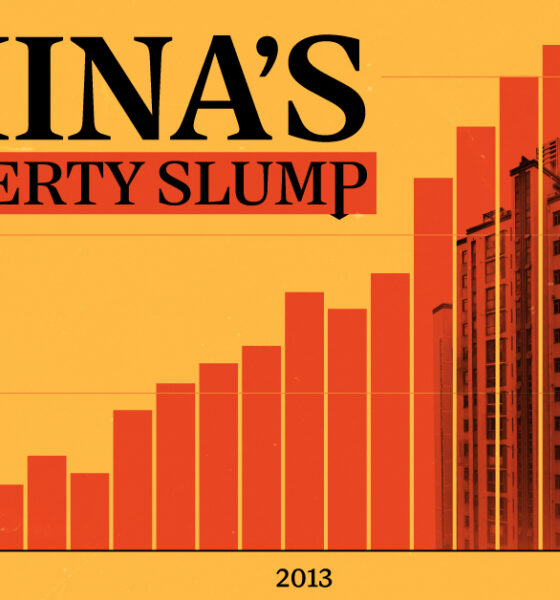
These charts show China's real estate boom in the 21st century and the subsequent slowdown since 2022.


What is the Chinese public's view of world powers? This visual breaks down Chinese sentiment towards other countries.
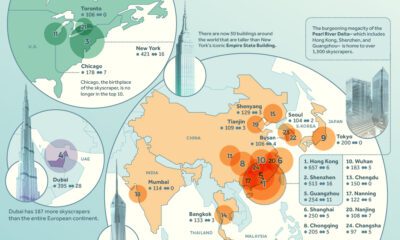

We rank the world's leading cities with the most skyscrapers, highlighting China's remarkable dominance in building vertically.
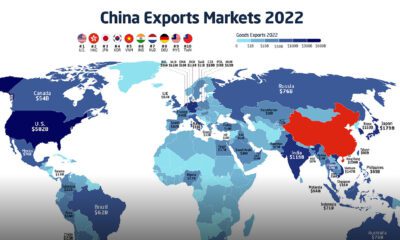

In 2022, China exported $3.6 trillion of goods, more than the GDP of the UK or India. Here's how Chinese exports have evolved since 2001.
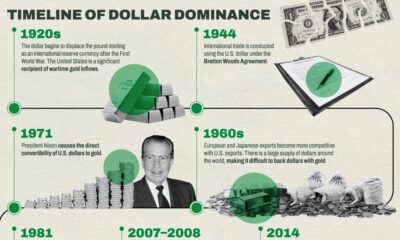

The U.S. dollar is the dominant currency in the global financial system, but some countries are following the trend of de-dollarization.


This pie chart, circa 1914, is a fascinating breakdown of China's export economy just prior to World War I.
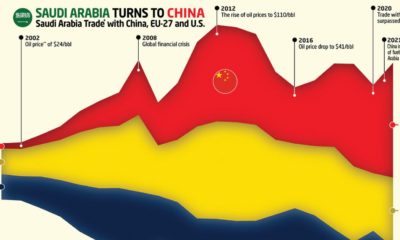

This graphic charts Saudi Arabia’s trading history with the EU, the U.S., and it's new largest trading partner — China.


This infographic breaks down battery manufacturing capacity by country in 2022 and 2027.
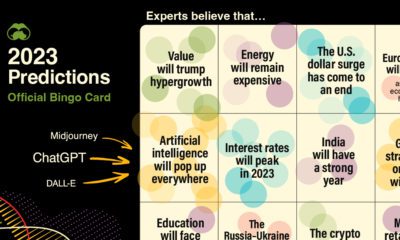

Using our database of 500+ predictions from reports, articles, interviews, and more, we highlight what experts think will happen in 2023
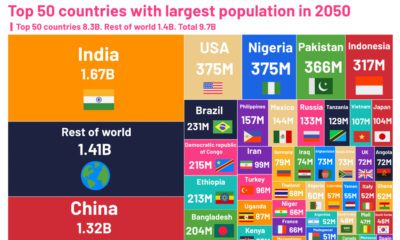

These charts highlight the changing world population between 2022 and 2050, showing which countries are growing—and shrinking—the fastest.


This visualization breaks down how household wealth is distributed around the world. Just 10 countries now account for 75% of total household wealth.


 Creator Program