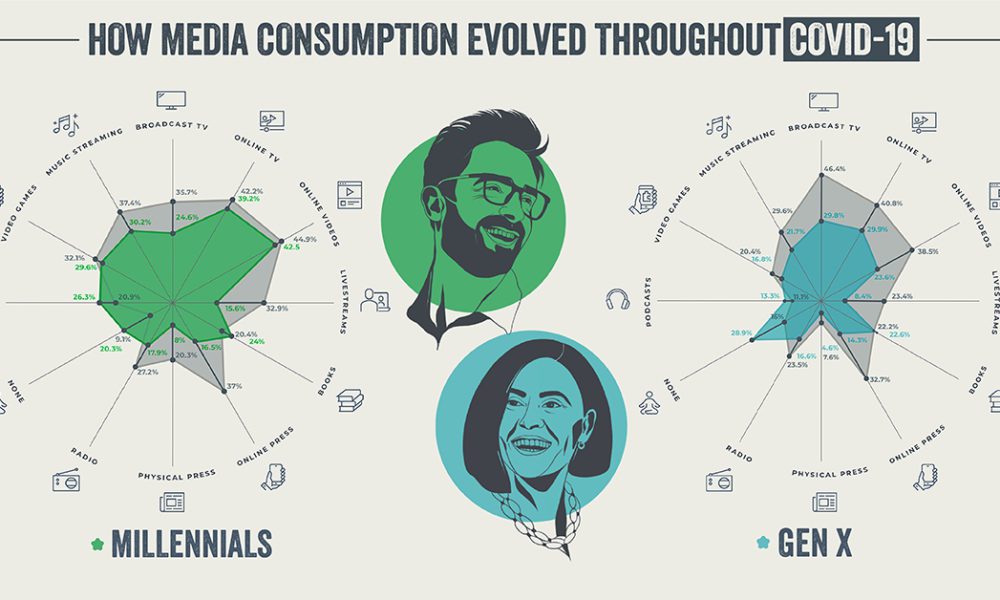
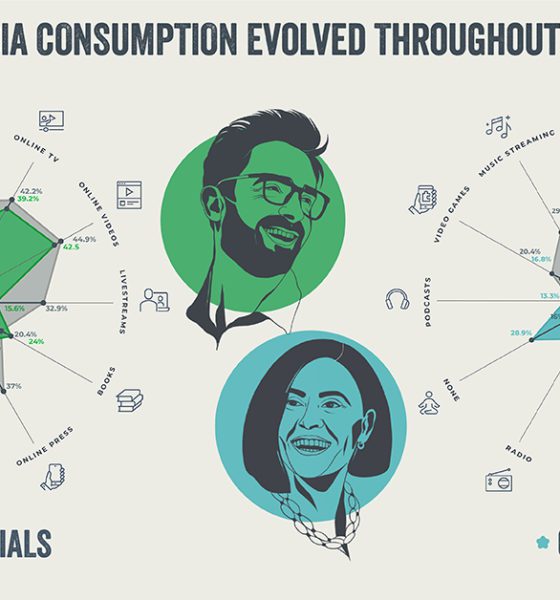
This infographic examines trends in each generation's media consumption to see how Americans adapted during the pandemic.
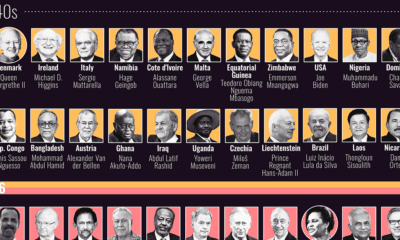

This graphic visualizes the ages of every country’s head of state, and compares them with the median population of their respective states.


There are over 2,700 billionaires in the world, but how many are millennials? This visual breaks down the richest millennial billionaires.
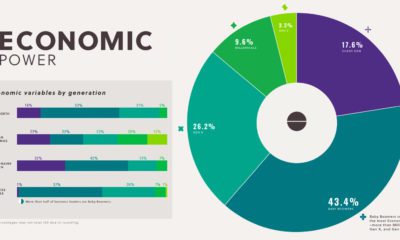

Baby Boomers hold more economic power than Gen X, Millennials, and Gen Z together. See how it all breaks down.
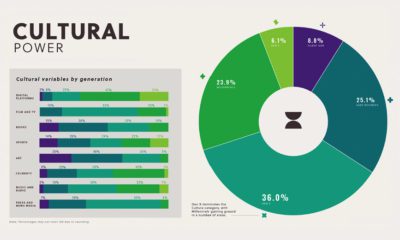

Visual Capitalist's first-ever Generational Power Index looks at which U.S. generation holds the most cultural influence in American society.
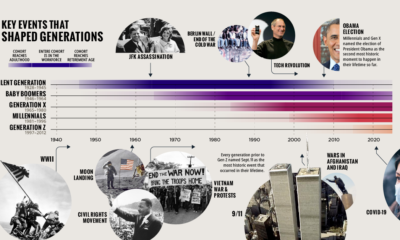

This timeline, from our Generational Power Index report, explores defining events in U.S. history that impacted each generation.
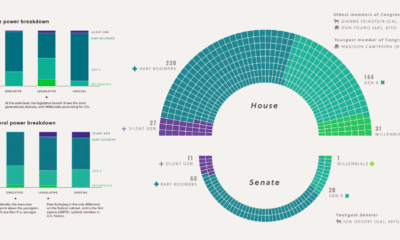

Visual Capitalist's inaugural Generational Power Index (GPI) examines the political power held by each generation and their influence on society.
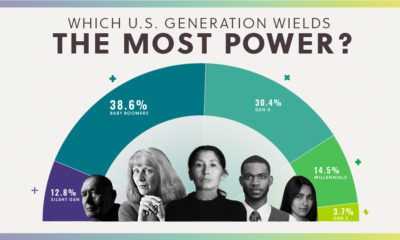

Using data from our new Generational Power Index, we look at how much economic, political, and cultural power each U.S. generation holds.
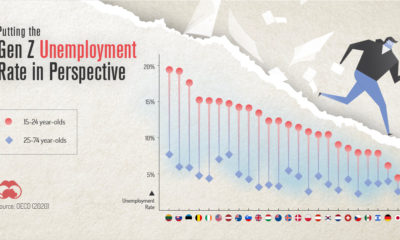

COVID-19 has impacted everyone, but one generation is taking it harder than the others. This graphic reveals the Gen Z unemployment rate.
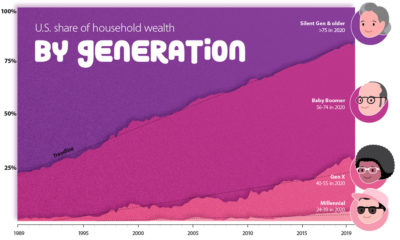

How large is the wealth gap between Millennials, Gen X, and Baby Boomers? We visualize the growing wealth disparity by generation and age.


 Creator Program