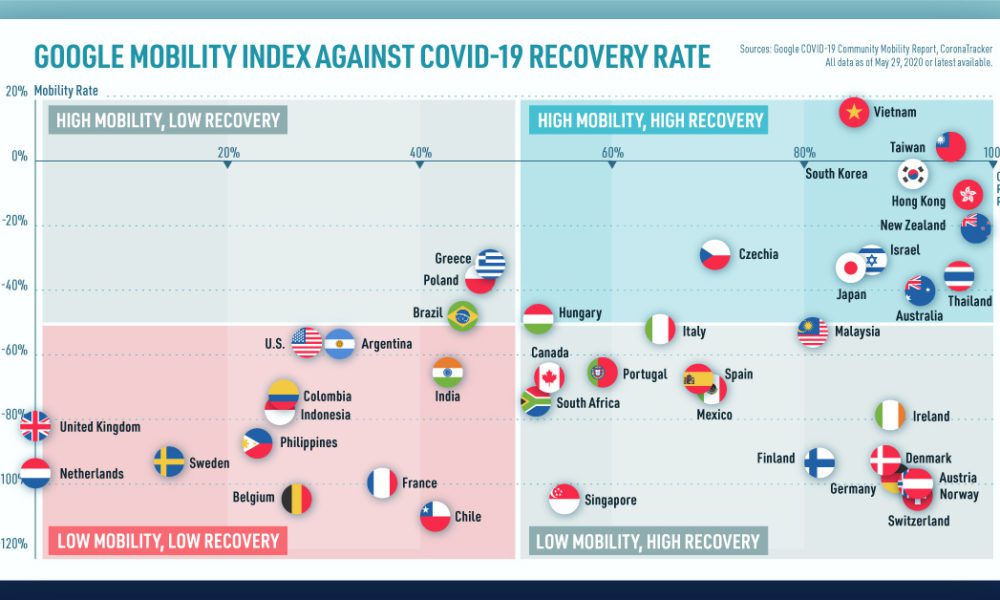
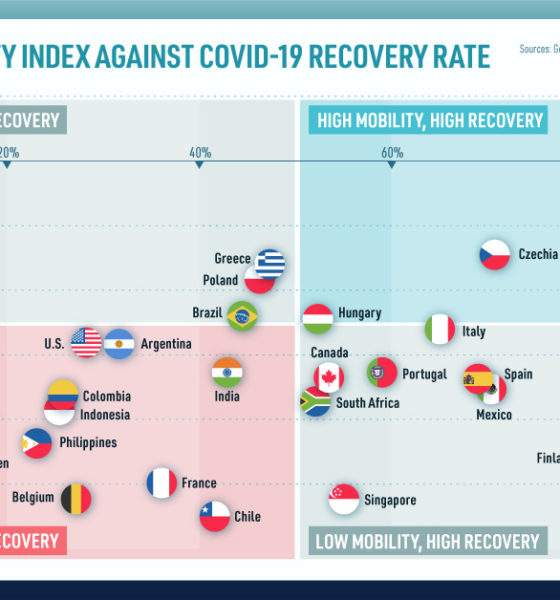
We look at mobility rates as well as COVID-19 recovery rates for 41 economies, to see which countries are reopening...
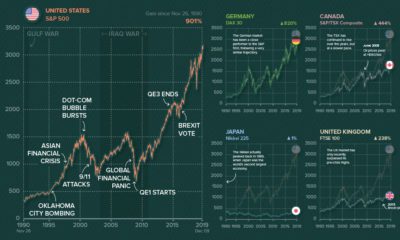

Ever wonder what other major stock markets would look like, if they were on the same scale of the S&P 500? We chart them all over...
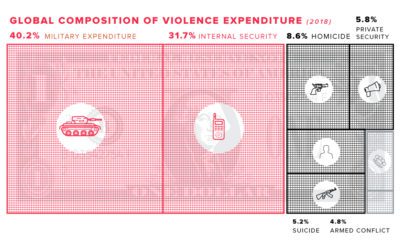

This graphic estimates the direct and indirect costs associated with violence, and explores how they are negatively impacting the global economy.
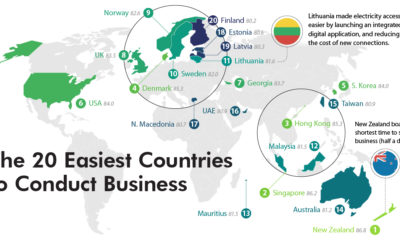

Entrepreneurship is challenging at the best of times. Here are the countries where at least starting a new business is easy to do.
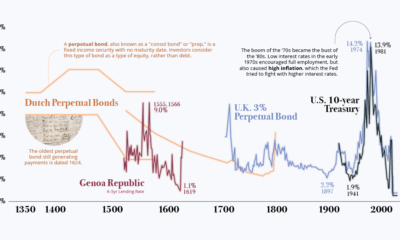

Interest rates sit near generational lows — is this the new normal, or has it been the trend all along? We show a history of interest...
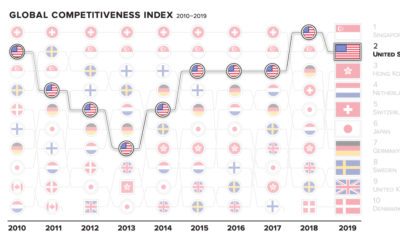

The world's top countries excel in many fields—but there can only be one #1. How have the most competitive economies shifted in the past decade?
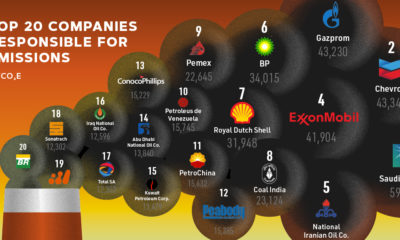

Since 1965, over ⅓ of the world’s cumulative carbon emissions can be traced back to just 20 fossil fuel companies. Who are the biggest contributors?


The ‘Big Five’ tech companies are rapidly reshaping the global tech landscape with their acquisitions, devouring any competitor who gets in their way.
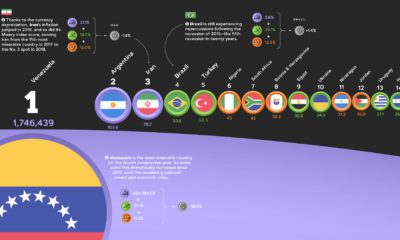

The annual Misery Index ranks the most and least miserable countries, based on four economic factors—unemployment, inflation, lending rates, and GDP growth.
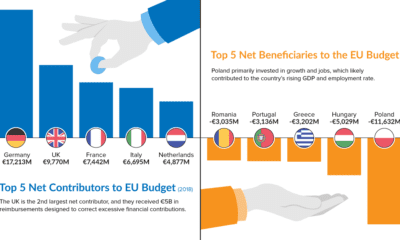

As Brexit looms, the EU budget is under the microscope. Learn which countries contribute the most—and least—to the bottom line in this chart.
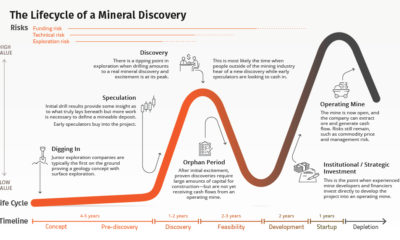

Building a mine takes time that poses risks at every stage. This graphic maps a mineral deposit from discovery to mining, showing where value is created.


