Markets
Is Brexit the First of Many Dominoes? [Chart]
![Is Brexit the First of Many Dominoes? [Chart]](https://www.visualcapitalist.com/wp-content/uploads/2016/06/brexit.jpg)
Is Brexit the First of Many Dominoes? [Chart]
UK and the Rest of Europe Brace for an Uncertain Future
The Chart of the Week is a weekly Visual Capitalist feature on Fridays.
Markets have been turned upside down by a surprise Brexit result and the resignation of David Cameron. While there is looming uncertainty around how this will affect the United Kingdom and Europe from an economic perspective, it might be just the tip of the iceberg in terms of long-run consequences.
A Brexit opens the door for future events that would be previously unfathomable by popular opinion, and it gives vital ammunition to groups that are seeking their own referendums for independence.
Unwilling Passengers?
As the UK ship distances itself from European docks, there are two passengers that may have been more comfortable remaining on shore.
While England and Wales voted to “Leave” with 53.4% and 52.5% respectively, Scotland and Northern Ireland were both firmly in “Remain” territory. Scotland, which previously held its own independence referendum in 2014, voted overwhelmingly to have the UK remain in the EU with a 62% vote. Northern Ireland had a similar sentiment with 55.8% voting “Remain”.
Scotland’s First Minister, Nicola Sturgeon, said today that a second independence referendum for Scotland is “highly likely”. She feels Scotland was taken out of the EU against its own will, and that Scottish independence is worth revisiting.
Meanwhile, Northern Ireland has echoed these calls, instead potentially looking at voting on a united Ireland. Northern Ireland is the only country in the UK that shares a land border with a country in the EU.
Other Dominoes
The Brexit result has energized other populist movements across the European Union. Anti-immigration leaders such as Geert Wilders and Marine Le Pen have ratcheted up cries for their own independence votes:
Hurrah for the British! Now it is our turn. Time for a Dutch referendum! #ByeByeEUhttps://t.co/kXZ0aQtgmx
— Geert Wilders (@geertwilderspvv) June 24, 2016
Victoire de la liberté ! Comme je le demande depuis des années, il faut maintenant le même référendum en France et dans les pays de l'UE MLP
— Marine Le Pen (@MLP_officiel) June 24, 2016
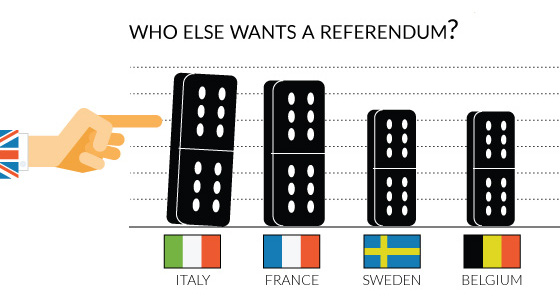
However, it is not just people on the fringe that are interested in revisiting EU membership. Even before the Brexit result, a poll by Ipsos Mori showed that the majority of people in France in Italy want to at least have a referendum on leaving:
Who else wants out? #uhoh pic.twitter.com/UwDESY3wQx
— ian bremmer (@ianbremmer) June 24, 2016
Meanwhile, over 40% of Swedes, Poles, and Belgians are in the same boat.
Now that Brexit is a thing, will these numbers trend higher? What will be the next domino to fall?


Markets
U.S. Debt Interest Payments Reach $1 Trillion
U.S. debt interest payments have surged past the $1 trillion dollar mark, amid high interest rates and an ever-expanding debt burden.


U.S. Debt Interest Payments Reach $1 Trillion
This was originally posted on our Voronoi app. Download the app for free on iOS or Android and discover incredible data-driven charts from a variety of trusted sources.
The cost of paying for America’s national debt crossed the $1 trillion dollar mark in 2023, driven by high interest rates and a record $34 trillion mountain of debt.
Over the last decade, U.S. debt interest payments have more than doubled amid vast government spending during the pandemic crisis. As debt payments continue to soar, the Congressional Budget Office (CBO) reported that debt servicing costs surpassed defense spending for the first time ever this year.
This graphic shows the sharp rise in U.S. debt payments, based on data from the Federal Reserve.
A $1 Trillion Interest Bill, and Growing
Below, we show how U.S. debt interest payments have risen at a faster pace than at another time in modern history:
| Date | Interest Payments | U.S. National Debt |
|---|---|---|
| 2023 | $1.0T | $34.0T |
| 2022 | $830B | $31.4T |
| 2021 | $612B | $29.6T |
| 2020 | $518B | $27.7T |
| 2019 | $564B | $23.2T |
| 2018 | $571B | $22.0T |
| 2017 | $493B | $20.5T |
| 2016 | $460B | $20.0T |
| 2015 | $435B | $18.9T |
| 2014 | $442B | $18.1T |
| 2013 | $425B | $17.2T |
| 2012 | $417B | $16.4T |
| 2011 | $433B | $15.2T |
| 2010 | $400B | $14.0T |
| 2009 | $354B | $12.3T |
| 2008 | $380B | $10.7T |
| 2007 | $414B | $9.2T |
| 2006 | $387B | $8.7T |
| 2005 | $355B | $8.2T |
| 2004 | $318B | $7.6T |
| 2003 | $294B | $7.0T |
| 2002 | $298B | $6.4T |
| 2001 | $318B | $5.9T |
| 2000 | $353B | $5.7T |
| 1999 | $353B | $5.8T |
| 1998 | $360B | $5.6T |
| 1997 | $368B | $5.5T |
| 1996 | $362B | $5.3T |
| 1995 | $357B | $5.0T |
| 1994 | $334B | $4.8T |
| 1993 | $311B | $4.5T |
| 1992 | $306B | $4.2T |
| 1991 | $308B | $3.8T |
| 1990 | $298B | $3.4T |
| 1989 | $275B | $3.0T |
| 1988 | $254B | $2.7T |
| 1987 | $240B | $2.4T |
| 1986 | $225B | $2.2T |
| 1985 | $219B | $1.9T |
| 1984 | $205B | $1.7T |
| 1983 | $176B | $1.4T |
| 1982 | $157B | $1.2T |
| 1981 | $142B | $1.0T |
| 1980 | $113B | $930.2B |
| 1979 | $96B | $845.1B |
| 1978 | $84B | $789.2B |
| 1977 | $69B | $718.9B |
| 1976 | $61B | $653.5B |
| 1975 | $55B | $576.6B |
| 1974 | $50B | $492.7B |
| 1973 | $45B | $469.1B |
| 1972 | $39B | $448.5B |
| 1971 | $36B | $424.1B |
| 1970 | $35B | $389.2B |
| 1969 | $30B | $368.2B |
| 1968 | $25B | $358.0B |
| 1967 | $23B | $344.7B |
| 1966 | $21B | $329.3B |
Interest payments represent seasonally adjusted annual rate at the end of Q4.
At current rates, the U.S. national debt is growing by a remarkable $1 trillion about every 100 days, equal to roughly $3.6 trillion per year.
As the national debt has ballooned, debt payments even exceeded Medicaid outlays in 2023—one of the government’s largest expenditures. On average, the U.S. spent more than $2 billion per day on interest costs last year. Going further, the U.S. government is projected to spend a historic $12.4 trillion on interest payments over the next decade, averaging about $37,100 per American.
Exacerbating matters is that the U.S. is running a steep deficit, which stood at $1.1 trillion for the first six months of fiscal 2024. This has accelerated due to the 43% increase in debt servicing costs along with a $31 billion dollar increase in defense spending from a year earlier. Additionally, a $30 billion increase in funding for the Federal Deposit Insurance Corporation in light of the regional banking crisis last year was a major contributor to the deficit increase.
Overall, the CBO forecasts that roughly 75% of the federal deficit’s increase will be due to interest costs by 2034.

-

 Real Estate2 weeks ago
Visualizing America’s Shortage of Affordable Homes
-

 Technology1 week ago
Ranked: Semiconductor Companies by Industry Revenue Share
-

 Money1 week ago
Which States Have the Highest Minimum Wage in America?
-

 Real Estate1 week ago
Ranked: The Most Valuable Housing Markets in America
-

 Business2 weeks ago
Charted: Big Four Market Share by S&P 500 Audits
-

 AI2 weeks ago
The Stock Performance of U.S. Chipmakers So Far in 2024
-

 Misc2 weeks ago
Almost Every EV Stock is Down After Q1 2024
-

 Money2 weeks ago
Where Does One U.S. Tax Dollar Go?