Misc
Brand Loyalty is Declining for Most Luxury Automakers


Brand Loyalty is Declining for Most Luxury Automakers
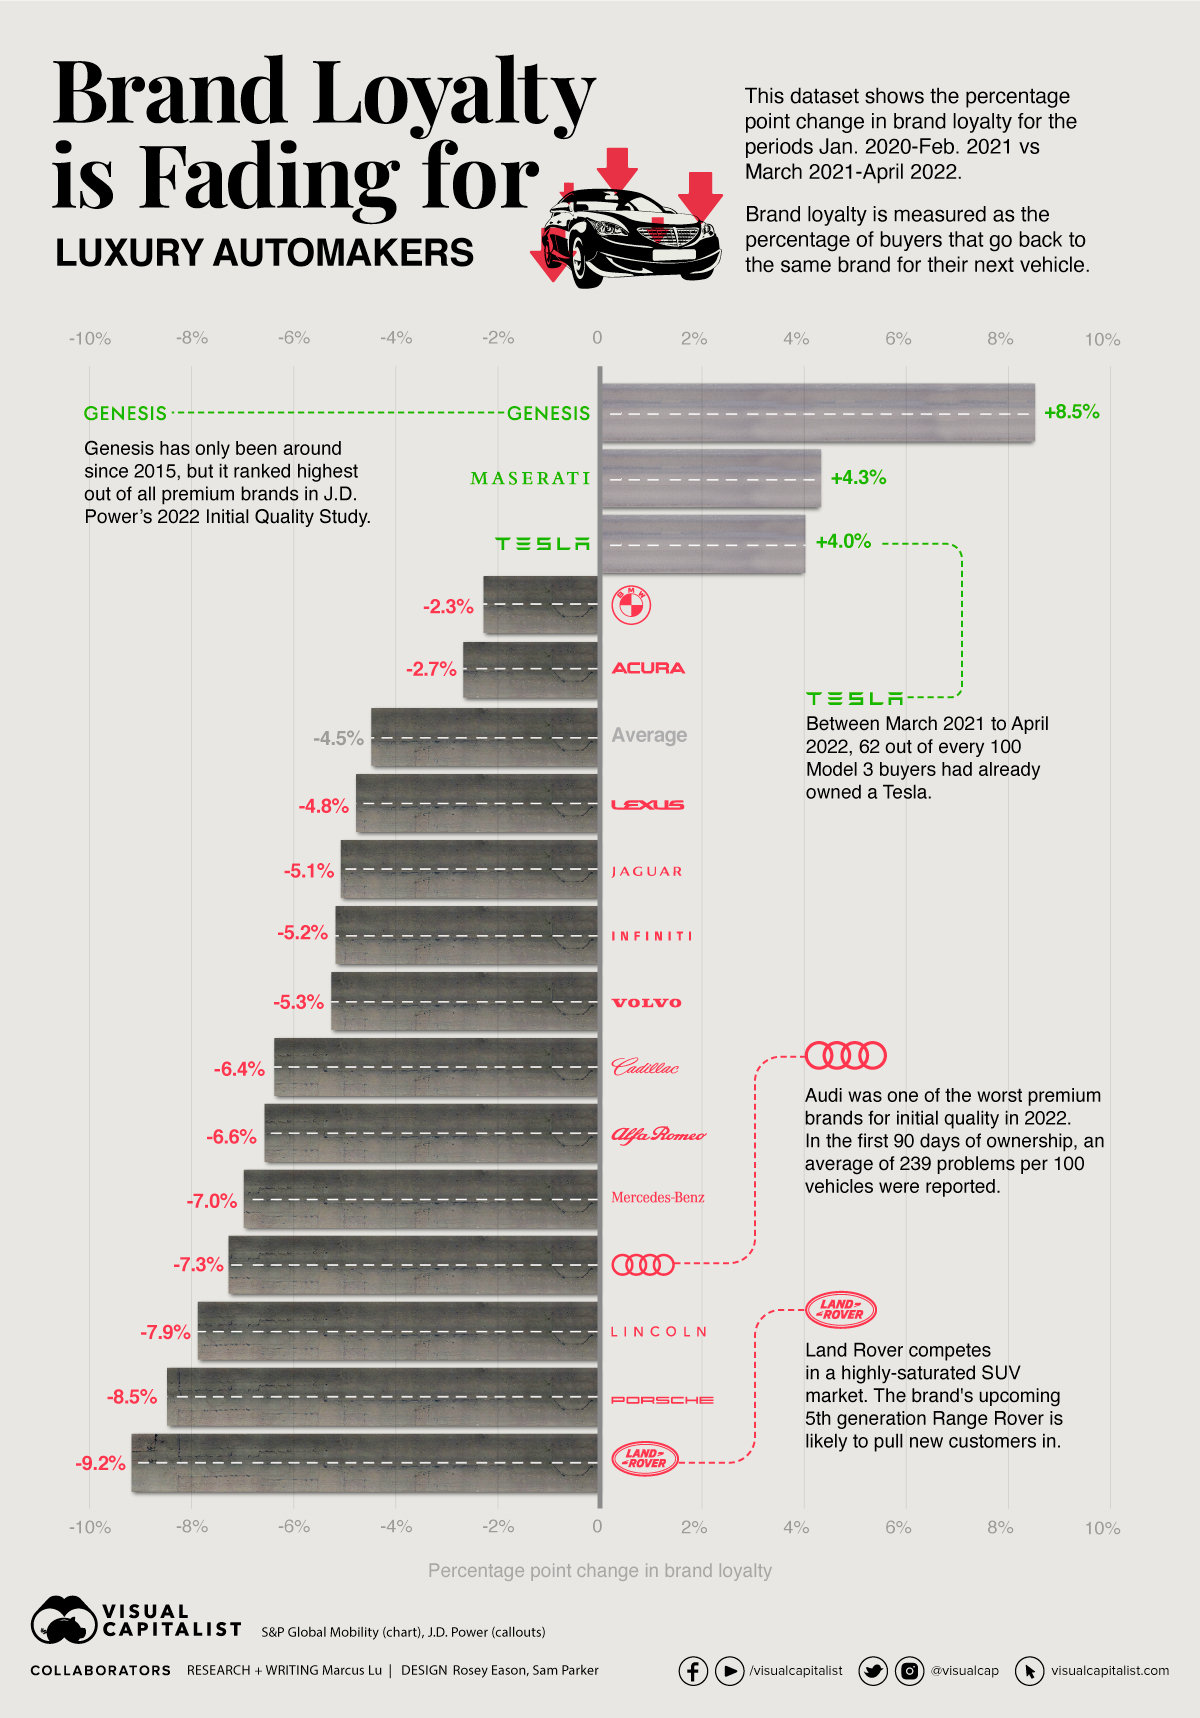
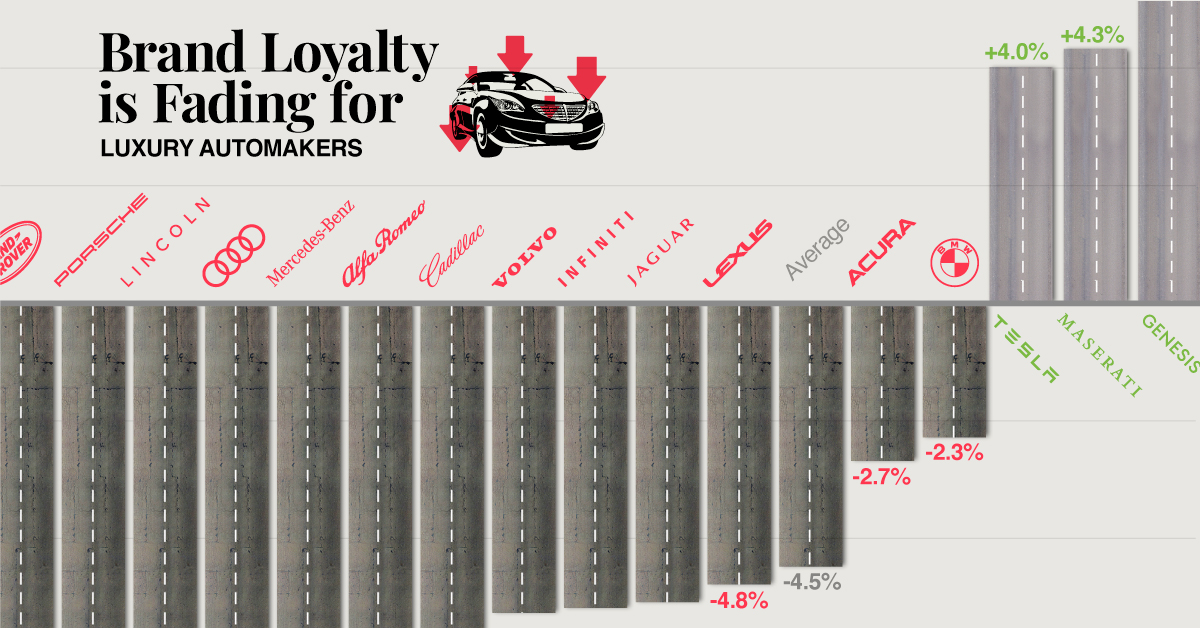
New research conducted by S&P Global Mobility has found that brand loyalty—measured as the percentage of buyers that go back to the same brand for their next vehicle—is falling across the luxury segment.
In this infographic, we’ve visualized the results of this research, which spans from January 2020 to April 2022.
Brand Loyalty Losers
The following brands have all experienced a drop in brand loyalty over the time period.
For additional context, we’ve also included each brand’s score in the J.D. Power 2022 Initial Quality Study. This is measured based on the number of problems experienced per 100 vehicles (PP100) in the first 90 days of ownership.
| Brand | Percentage Point Change in Brand Loyalty | PP100 |
|---|---|---|
| 🇬🇧 Land Rover | -9.2 | 193 |
| 🇩🇪 Porsche | -8.5 | 200 |
| 🇺🇸 Lincoln | -7.9 | 167 |
| 🇩🇪 Audi | -7.3 | 239 |
| 🇩🇪 Mercedes-Benz | -7.0 | 189 |
| 🇮🇹 Alfa Romeo | -6.6 | 211 |
| 🇺🇸 Cadillac | -6.4 | 163 |
| 🇸🇪 Volvo | -5.3 | 256 |
| 🇯🇵 Infiniti | -5.2 | 204 |
| 🇬🇧 Jaguar | -5.1 | 210 |
| 🇯🇵 Lexus | -4.8 | 157 |
| Luxury average | -4.5 | 199 |
| 🇯🇵 Acura | -2.7 | 192 |
| 🇩🇪 BMW | -2.3 | 165 |
Land Rover experienced the biggest drop in loyalty, despite a better than average PP100 rating. One potential reason is timing—the brand’s premier model, the Range Rover, has been in its fourth generation since 2012. The SUV has become relatively dated, though a new fifth generation was recently revealed for the 2022 model year.
Two Volkswagen Group brands, Audi and Porsche, also fared poorly in terms of loyalty. This is somewhat surprising, as both brands offer a portfolio of both gasoline and electric models. Many competitors, such as Acura, Lexus, and Maserati, have yet to release an EV.
Brand Loyalty Winners
Three brands have managed to buck the trend, as shown below.
| Brand | Percentage Point Change in Brand Loyalty | PP100 |
|---|---|---|
| Luxury average | -4.5 | 199 |
| 🇺🇸 Tesla | +4.0 | 226 |
| 🇮🇹 Maserati | +4.3 | 255 |
| 🇰🇷 Genesis | +8.5 | 156 |
We can draw parallels between Tesla and Apple, in that both have incredibly loyal followers.
For instance, between March 2021 to April 2022, 62% of buyers/households who returned to market and previously owned a Model 3 purchased a new Tesla. That’s an impressive statistic, especially when we consider Tesla’s history of build quality issues.
Maserati appears to be in the same boat. The Italian automaker has strengthened its brand loyalty by 4.3 percentage points, despite having the luxury segment’s worst PP100. Perhaps build quality matters less than we think.
Another Factor to Consider
Ongoing supply chain issues could also be contributing to wide-spread declines in loyalty. Rather than waiting several months (or in the case of EVs, years), buyers may switch to a different brand that has cars in stock.
We are still monitoring it week to week, but up to now basically worldwide, we had no issues running production.
– Joerg Burzer, Mercedes-Benz
Many automakers have reported that their supply issues are diminishing, though new economic challenges have risen. For example, surging inflation has pushed the price of a new car to record highs. Combined with rising interest rates (cost of borrowing), this could negatively impact the demand for new cars.


Misc
How Hard Is It to Get Into an Ivy League School?
We detail the admission rates and average annual cost for Ivy League schools, as well as the median SAT scores required to be accepted.


How Hard Is It to Get Into an Ivy League School?
This was originally posted on our Voronoi app. Download the app for free on iOS or Android and discover incredible data-driven charts from a variety of trusted sources.
Ivy League institutions are renowned worldwide for their academic excellence and long-standing traditions. But how hard is it to get into one of the top universities in the U.S.?
In this graphic, we detail the admission rates and average annual cost for Ivy League schools, as well as the median SAT scores required to be accepted. The data comes from the National Center for Education Statistics and was compiled by 24/7 Wall St.
Note that “average annual cost” represents the net price a student pays after subtracting the average value of grants and/or scholarships received.
Harvard is the Most Selective
The SAT is a standardized test commonly used for college admissions in the United States. It’s taken by high school juniors and seniors to assess their readiness for college-level academic work.
When comparing SAT scores, Harvard and Dartmouth are among the most challenging universities to gain admission to. The median SAT scores for their students are 760 for reading and writing and 790 for math. Still, Harvard has half the admission rate (3.2%) compared to Dartmouth (6.4%).
| School | Admission rate (%) | SAT Score: Reading & Writing | SAT Score: Math | Avg Annual Cost* |
|---|---|---|---|---|
| Harvard University | 3.2 | 760 | 790 | $13,259 |
| Columbia University | 3.9 | 750 | 780 | $12,836 |
| Yale University | 4.6 | 760 | 780 | $16,341 |
| Brown University | 5.1 | 760 | 780 | $26,308 |
| Princeton University | 5.7 | 760 | 780 | $11,080 |
| Dartmouth College | 6.4 | 760 | 790 | $33,023 |
| University of Pennsylvania | 6.5 | 750 | 790 | $14,851 |
| Cornell University | 7.5 | 750 | 780 | $29,011 |
*Costs after receiving federal financial aid.
Additionally, Dartmouth has the highest average annual cost at $33,000. Princeton has the lowest at $11,100.
While student debt has surged in the United States in recent years, hitting $1.73 trillion in 2023, the worth of obtaining a degree from any of the schools listed surpasses mere academics. This is evidenced by the substantial incomes earned by former students.
Harvard grads, for example, have the highest average starting salary in the country, at $91,700.

-

 Maps2 weeks ago
Mapped: Average Wages Across Europe
-

 Money1 week ago
Which States Have the Highest Minimum Wage in America?
-

 Real Estate1 week ago
Ranked: The Most Valuable Housing Markets in America
-

 Markets1 week ago
Charted: Big Four Market Share by S&P 500 Audits
-

 AI1 week ago
The Stock Performance of U.S. Chipmakers So Far in 2024
-

 Misc1 week ago
Almost Every EV Stock is Down After Q1 2024
-

 Money2 weeks ago
Where Does One U.S. Tax Dollar Go?
-

 Green2 weeks ago
Ranked: Top Countries by Total Forest Loss Since 2001