Misc
Visualizing the Books That Bill Gates Loves and Recommends
Bill Gates loves books.
The co-founder of Microsoft and heavyweight philanthropist says he reads around 50 books each year, or the equivalent of one per week for those keeping score at home.
The Stamp of Approval
On occasion, a book is so good that Mr. Gates will recommend it on his popular blog, Gates Notes. Over the years, there have been nearly 190 such recommendations on his blog, with underlying themes such as how things work and the quirks of human nature.
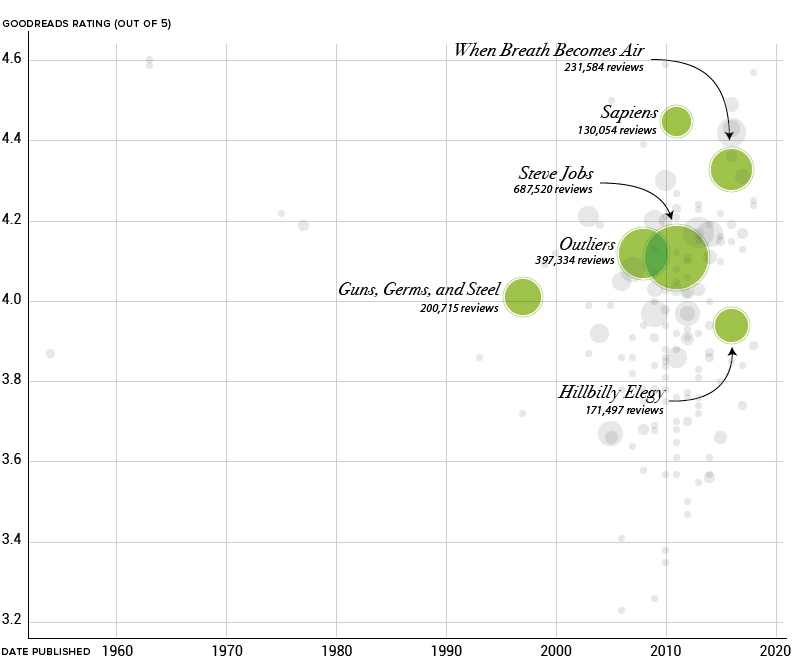
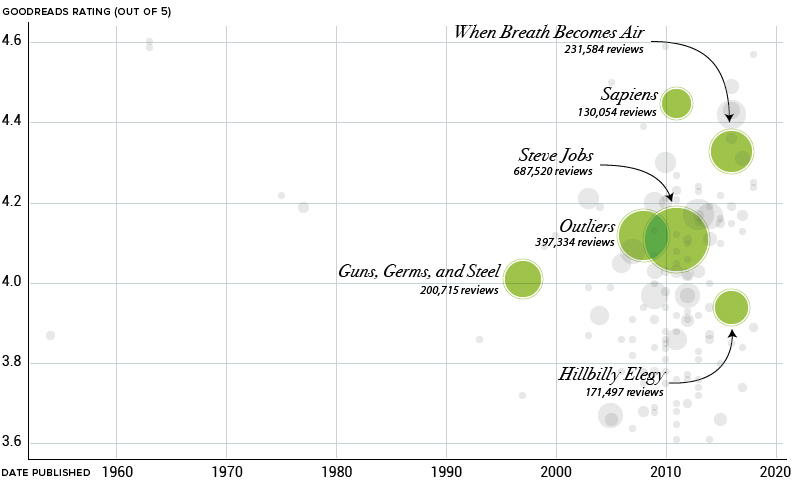
Today’s visualization below breaks down over 150 of Gates’ nonfiction recommendations by plotting each book based on review scores from GoodReads, one of the world’s most popular sites for book reviews. Meanwhile, the bubbles are sized based on the number of reviews, giving an approximation of the book’s overall popularity.
As an avid reader and influential person, Gates’ book recommendations hold a lot of weight, so it’s worth taking a closer look at the list.
Bill Reads Bestsellers, Too
When between scientific tomes and tennis player autobiographies, Bill Gates reads the bestsellers just like everyone else. More prominent circles on our visualization include now iconic books such as Guns, Germs, and Steel by Jared Diamond, and Steve Jobs, the biography written by Walter Isaacson.
There’s something comforting in the fact that one of the world’s richest people is gaining insight from the same book you can borrow from the library for free. There’s no billionaire version of Enlightenment Now.
Vaclav Smil’s Biggest Fan
While Bill Gates has recommended some hugely successful books, he’s also not afraid to introduce his audience to niche selections. A prime example of this is the long list of books by Czech-Canadian scientist and policy analyst, Vaclav Smil.
A prolific author, Smil has published dozens of books over his distinguished career that cover topics ranging from global energy to whether humans should be eating meat.
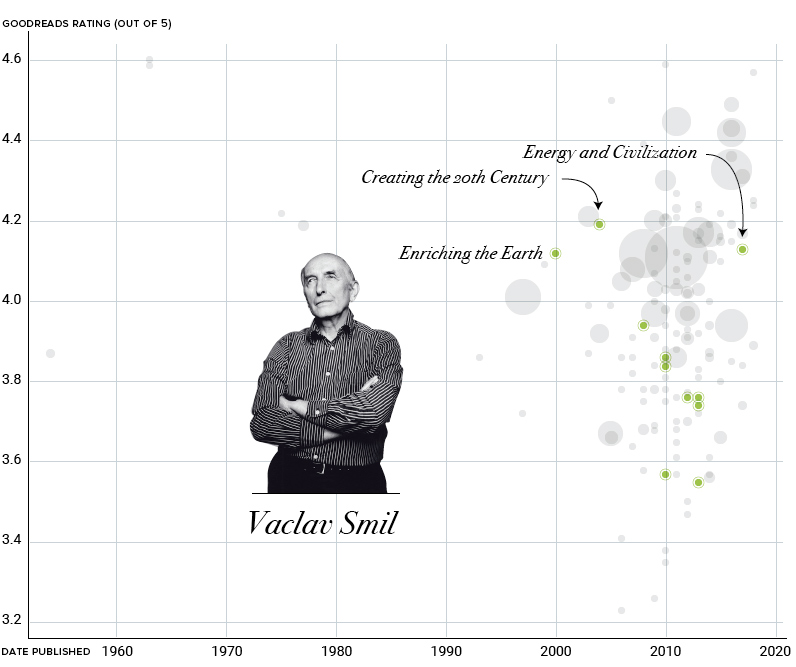
I wait for new Smil books the way some people wait for the next Star Wars movie.
– Bill Gates
Rich Visual Content
Within the long list of books with a conventional format are a few titles that have a decidedly more visual component. Interestingly, they come from books published over a half-century apart.
The first example is How to Lie with Statistics by Darrell Huff and illustrated by Irving Geis. This unique book is full of inventive illustrations that help demonstrate concepts that would be cumbersome to explain in text form. In the age of fake news, How to Lie with Statistics has seen renewed popularity, with come help from Bill Gates’ recommendation.
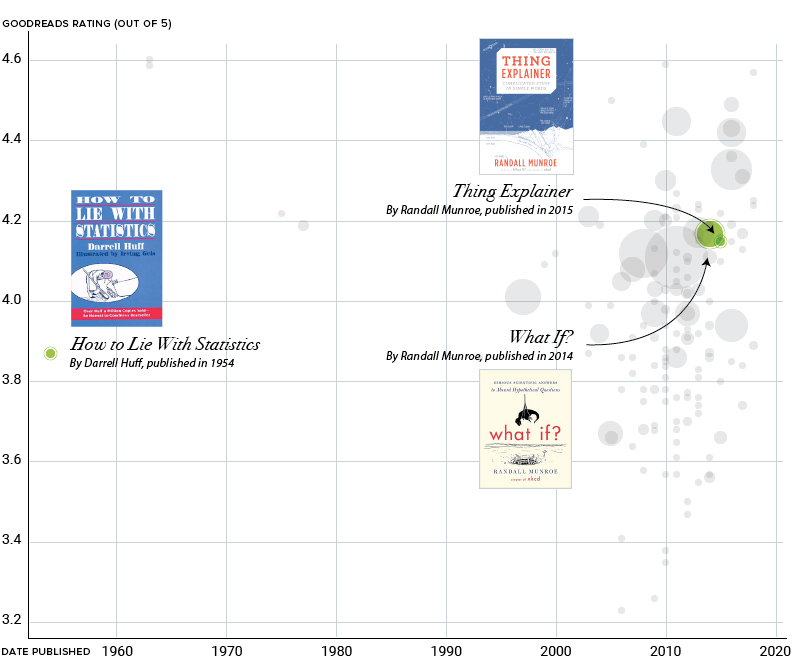
Next, are two books published by Randall Munroe of XKCD fame. These books embrace a more diagrammatic approach to explaining complex concepts in Munroe’s quirky style.
Summer Reading
Based on the popularity of Gates’ recent 5 Books Worth Reading This Summer post, it’s safe to say this body of recommendations will continue to grow.
In case you missed it: Visual Capitalist recently published a book called Visualizing Change.
Correction: One of the graphics in this post previously listed the book Hillbilly Elegy as “Hillbilly Eulogy”. We regret the error.


VC+
VC+: Get Our Key Takeaways From the IMF’s World Economic Outlook
A sneak preview of the exclusive VC+ Special Dispatch—your shortcut to understanding IMF’s World Economic Outlook report.

Have you read IMF’s latest World Economic Outlook yet? At a daunting 202 pages, we don’t blame you if it’s still on your to-do list.
But don’t worry, you don’t need to read the whole April release, because we’ve already done the hard work for you.
To save you time and effort, the Visual Capitalist team has compiled a visual analysis of everything you need to know from the report—and our upcoming VC+ Special Dispatch will be available exclusively to VC+ members on Thursday, April 25th.
If you’re not already subscribed to VC+, make sure you sign up now to receive the full analysis of the IMF report, and more (we release similar deep dives every week).
For now, here’s what VC+ members can expect to receive.
Your Shortcut to Understanding IMF’s World Economic Outlook
With long and short-term growth prospects declining for many countries around the world, this Special Dispatch offers a visual analysis of the key figures and takeaways from the IMF’s report including:
- The global decline in economic growth forecasts
- Real GDP growth and inflation forecasts for major nations in 2024
- When interest rate cuts will happen and interest rate forecasts
- How debt-to-GDP ratios have changed since 2000
- And much more!

Get the Full Breakdown in the Next VC+ Special Dispatch
VC+ members will receive the full Special Dispatch on Thursday, April 25th.
Make sure you join VC+ now to receive exclusive charts and the full analysis of key takeaways from IMF’s World Economic Outlook.
Don’t miss out. Become a VC+ member today.
What You Get When You Become a VC+ Member
VC+ is Visual Capitalist’s premium subscription. As a member, you’ll get the following:
- Special Dispatches: Deep dive visual briefings on crucial reports and global trends
- Markets This Month: A snappy summary of the state of the markets and what to look out for
- The Trendline: Weekly curation of the best visualizations from across the globe
- Global Forecast Series: Our flagship annual report that covers everything you need to know related to the economy, markets, geopolitics, and the latest tech trends
- VC+ Archive: Hundreds of previously released VC+ briefings and reports that you’ve been missing out on, all in one dedicated hub
You can get all of the above, and more, by joining VC+ today.

-

 Markets1 week ago
U.S. Debt Interest Payments Reach $1 Trillion
-

 Business2 weeks ago
Charted: Big Four Market Share by S&P 500 Audits
-

 Real Estate2 weeks ago
Ranked: The Most Valuable Housing Markets in America
-

 Money2 weeks ago
Which States Have the Highest Minimum Wage in America?
-

 AI2 weeks ago
Ranked: Semiconductor Companies by Industry Revenue Share
-

 Markets2 weeks ago
Ranked: The World’s Top Flight Routes, by Revenue
-

 Demographics2 weeks ago
Population Projections: The World’s 6 Largest Countries in 2075
-

 Markets2 weeks ago
The Top 10 States by Real GDP Growth in 2023