Misc
Ranked: Biggest Fast Food Chains in America
Ranked: The Biggest Fast Food Chains in America
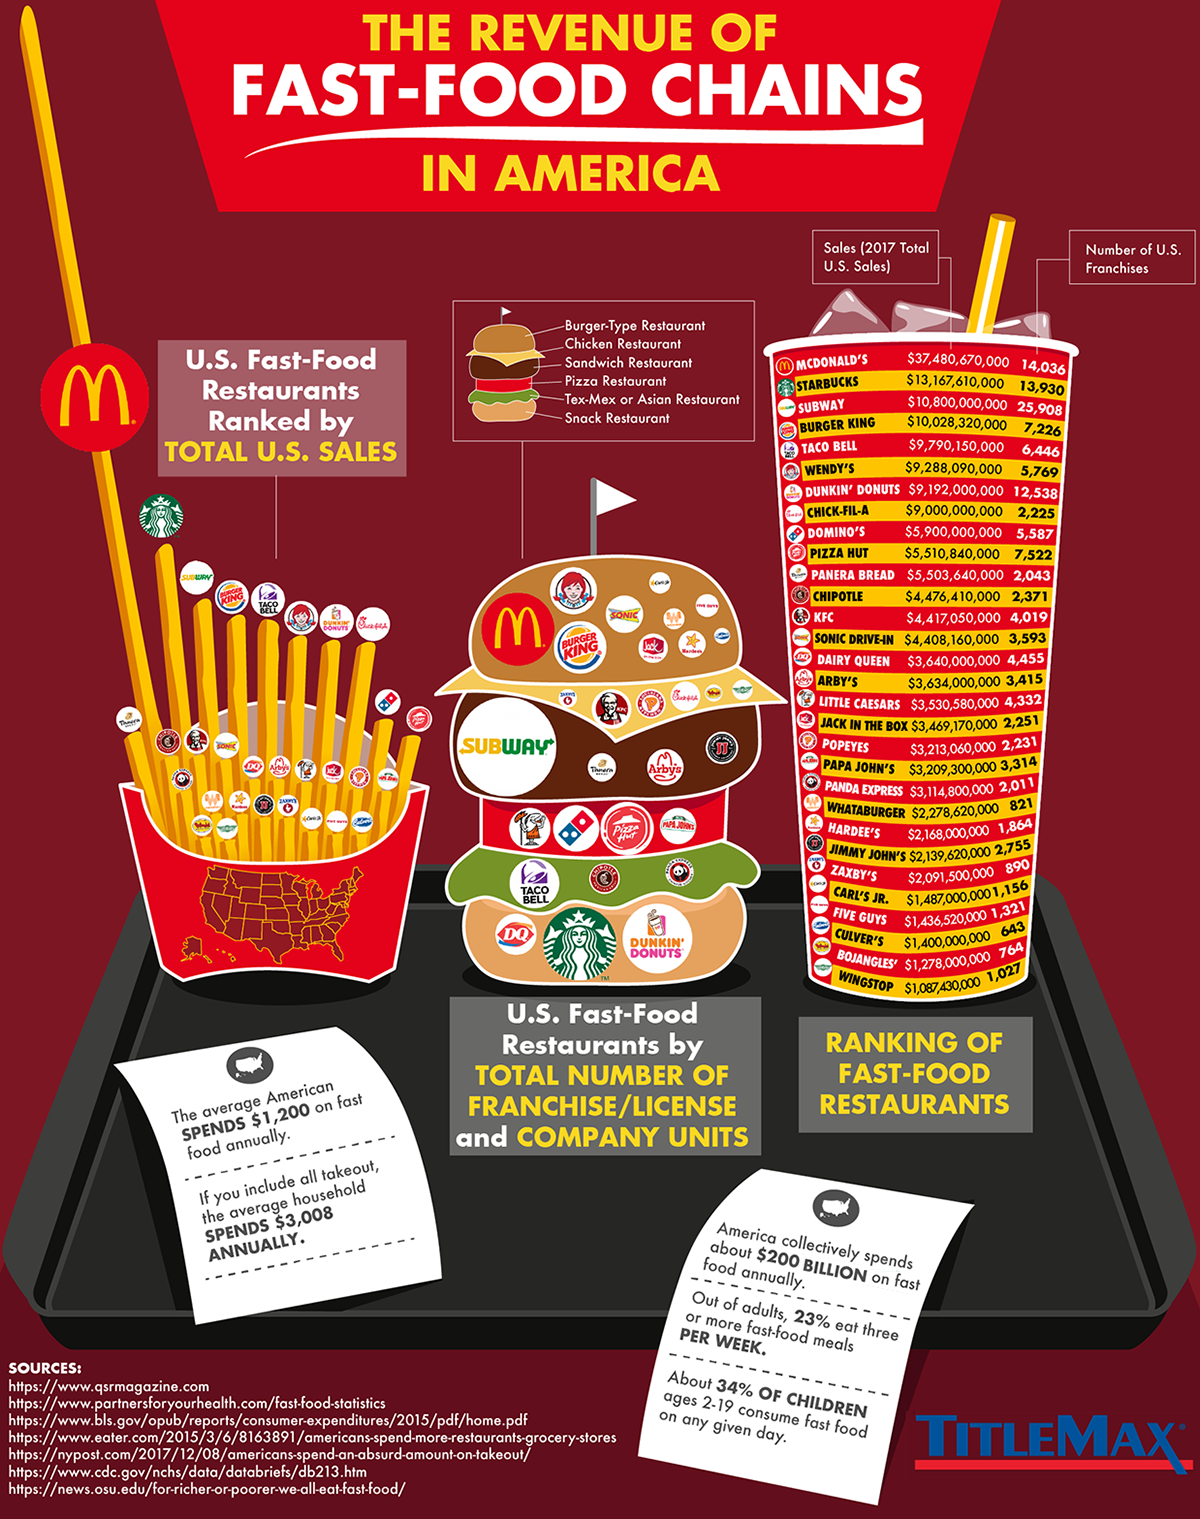
Fast food is a supersized business in America.
The average American spends as much as $1,200 every year on fast food — and roughly a quarter of the U.S. population eats three or more fast food meals per week.
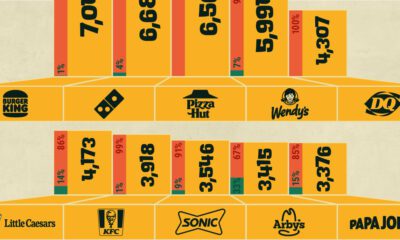
Today’s unique infographic, via TitleMax, shows just how dominant the quick serve food industry is, and which brands are leading the pack in terms of revenue and store locations.
Billions Served
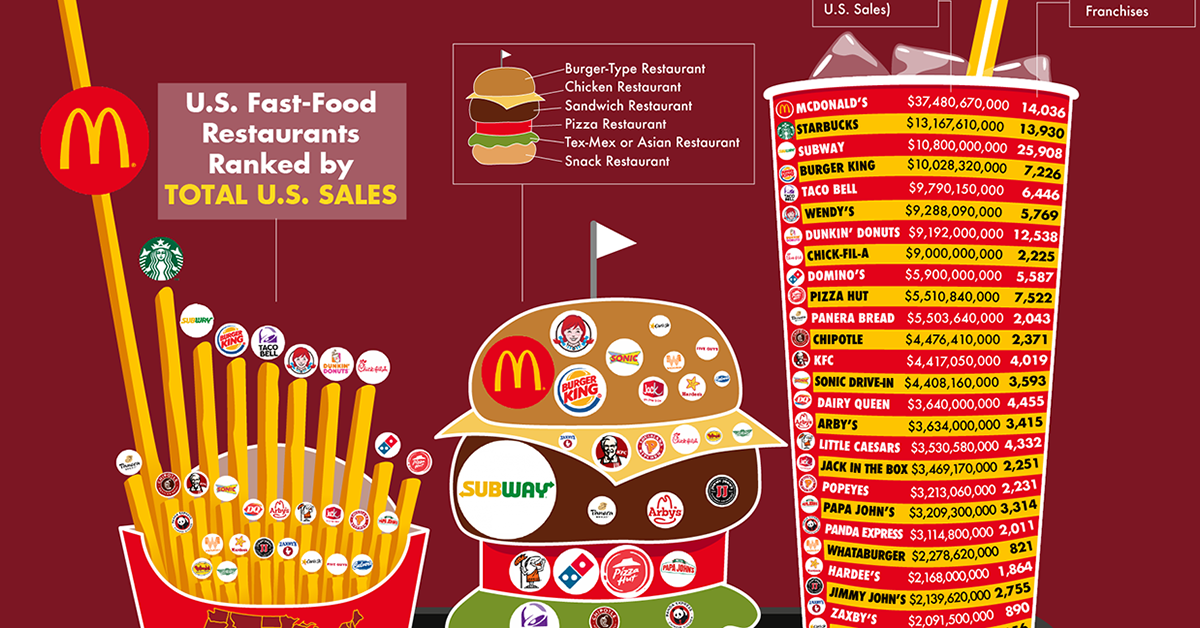
All of the biggest fast food chains now top $1 billion in sales annually. McDonald’s leads the pack with almost triple the sales of the number two chain, Starbucks.
Below are the top 30 fast food chains in the United States by revenue:
| Rank | Chain | Sales (U.S., 2017) | # of Locations (U.S.) |
|---|---|---|---|
| 1 | McDonald's | $37.5B | 14,036 |
| 2 | Starbucks | $13.2B | 13,930 |
| 3 | Subway | $10.8B | 25,908 |
| 4 | Burger King | $9.8B | 7,226 |
| 5 | Taco Bell | $9.3B | 6,446 |
| 6 | Wendy's | $9.3B | 5,769 |
| 7 | Dunkin' Donuts | $5.9B | 12,538 |
| 8 | Chick-fil-A | $9.0B | 2,225 |
| 9 | Domino's | $5.9B | 5,587 |
| 10 | Pizza Hut | $5.5B | 7,522 |
| 11 | Panera Bread | $4.5B | 2,043 |
| 12 | Chipotle | $4.5B | 2,371 |
| 13 | KFC | $4.4B | 4,019 |
| 14 | Sonic Drive-In | $4.4B | 3,593 |
| 15 | Dairy Queen | $3.6B | 4,455 |
| 16 | Arby's | $3.6B | 3,415 |
| 17 | Little Caesars | $3.5B | 4,332 |
| 18 | Jack in the Box | $3.5B | 2,251 |
| 19 | Popeye's | $3.2B | 2,231 |
| 20 | Papa John's | $3.1B | 3,314 |
| 21 | Panda Express | $2.3B | 2,011 |
| 22 | Whataburger | $2.3B | 821 |
| 23 | Hardee's | $2.2B | 1,864 |
| 24 | Jimmy John's | $2.1B | 2,755 |
| 25 | Zaxby's | $2.1B | 890 |
| 26 | Carl's Jr. | $1.5B | 1,156 |
| 27 | Five Guys | $1.4B | 1,321 |
| 28 | Culver's | $1.4B | 643 |
| 29 | Bojangles' | $1.3B | 764 |
| 30 | Wingstop | $1.1B | 1,027 |
In 2017, the top 30 fast food chains rang up $172 billion in sales at over 140,000 locations across the United States. When smaller chains are also included, annual industry revenue tops a whopping $200 billion.
Location, Location
Fast food can be a profitable business, but certain chains are runaway successes when sales-per-unit are considered. Chick-fil-A’s sales average out to $4.3 million per location — 53% higher than McDonald’s, which brings in $2.8 million of sales per location.
Subway, which is known for having a low franchise fee and no exclusive territory rights, has the lowest sales-per-unit in the top 30 ($419,792).
That said, no one can compare to Subway in terms of sheer volume. The chain has over 25,000 locations, making it not only the biggest fast food chain in the country, but the most common retailer overall (even beating out dollar stores). It’s possible that America has seen peak Subway though — the number of locations has been steadily dropping since 2011.
On the opposite end of the spectrum is Starbucks. The Seattle-based coffee chain has been relentlessly expanding over the past decade.
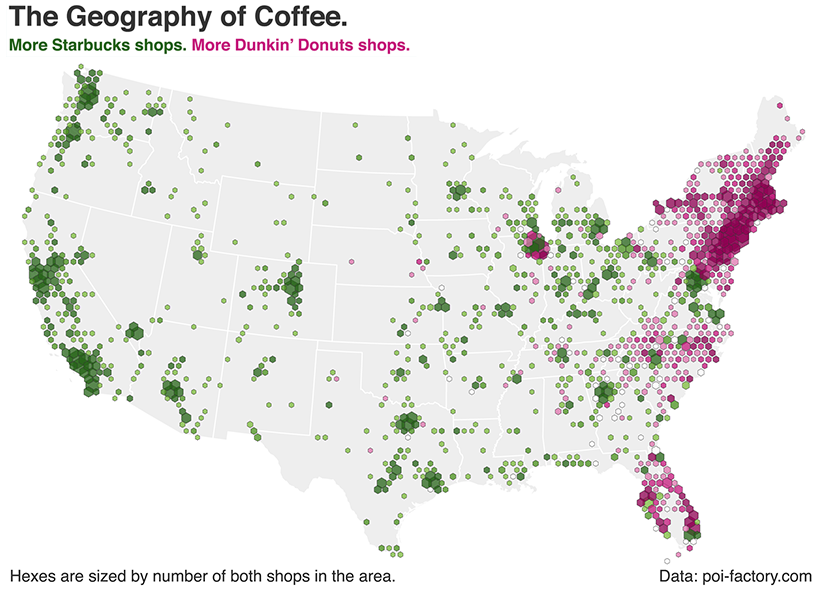
Regional Preferences
Of course, not all fast food chains have the ubiquity of Subway and McDonald’s. Many of these brands have achieved impressive sales numbers in specific regions. Whether you’re loyal to Dunkin’ Donuts, Chick-fil-A, or In-N-Out may depend heavily on where you live.
Will America’s next big fast food powerhouse come from an already-strong regional chain, or will it be the result of a new phenomenon, completely?


Misc
How Hard Is It to Get Into an Ivy League School?
We detail the admission rates and average annual cost for Ivy League schools, as well as the median SAT scores required to be accepted.


How Hard Is It to Get Into an Ivy League School?
This was originally posted on our Voronoi app. Download the app for free on iOS or Android and discover incredible data-driven charts from a variety of trusted sources.
Ivy League institutions are renowned worldwide for their academic excellence and long-standing traditions. But how hard is it to get into one of the top universities in the U.S.?
In this graphic, we detail the admission rates and average annual cost for Ivy League schools, as well as the median SAT scores required to be accepted. The data comes from the National Center for Education Statistics and was compiled by 24/7 Wall St.
Note that “average annual cost” represents the net price a student pays after subtracting the average value of grants and/or scholarships received.
Harvard is the Most Selective
The SAT is a standardized test commonly used for college admissions in the United States. It’s taken by high school juniors and seniors to assess their readiness for college-level academic work.
When comparing SAT scores, Harvard and Dartmouth are among the most challenging universities to gain admission to. The median SAT scores for their students are 760 for reading and writing and 790 for math. Still, Harvard has half the admission rate (3.2%) compared to Dartmouth (6.4%).
| School | Admission rate (%) | SAT Score: Reading & Writing | SAT Score: Math | Avg Annual Cost* |
|---|---|---|---|---|
| Harvard University | 3.2 | 760 | 790 | $13,259 |
| Columbia University | 3.9 | 750 | 780 | $12,836 |
| Yale University | 4.6 | 760 | 780 | $16,341 |
| Brown University | 5.1 | 760 | 780 | $26,308 |
| Princeton University | 5.7 | 760 | 780 | $11,080 |
| Dartmouth College | 6.4 | 760 | 790 | $33,023 |
| University of Pennsylvania | 6.5 | 750 | 790 | $14,851 |
| Cornell University | 7.5 | 750 | 780 | $29,011 |
*Costs after receiving federal financial aid.
Additionally, Dartmouth has the highest average annual cost at $33,000. Princeton has the lowest at $11,100.
While student debt has surged in the United States in recent years, hitting $1.73 trillion in 2023, the worth of obtaining a degree from any of the schools listed surpasses mere academics. This is evidenced by the substantial incomes earned by former students.
Harvard grads, for example, have the highest average starting salary in the country, at $91,700.

-

 Real Estate2 weeks ago
Visualizing America’s Shortage of Affordable Homes
-

 Technology1 week ago
Ranked: Semiconductor Companies by Industry Revenue Share
-

 Money1 week ago
Which States Have the Highest Minimum Wage in America?
-

 Real Estate1 week ago
Ranked: The Most Valuable Housing Markets in America
-

 Business2 weeks ago
Charted: Big Four Market Share by S&P 500 Audits
-

 AI2 weeks ago
The Stock Performance of U.S. Chipmakers So Far in 2024
-

 Misc2 weeks ago
Almost Every EV Stock is Down After Q1 2024
-

 Money2 weeks ago
Where Does One U.S. Tax Dollar Go?