Energy
Battery Megafactory Forecast: 400% Increase in Capacity to 1 TWh by 2028
Battery Megafactory Forecast
The Chart of the Week is a weekly Visual Capitalist feature on Fridays.
When ground broke on the massive Tesla Gigafactory in Nevada in 2014, the world marveled at the project’s audacity, size, and scope.
At the time, it was touted that the cutting-edge facility would be the largest building in the world by footprint, and that the Gigafactory would single-handedly be capable of doubling the world’s lithium-ion battery production capacity.
What many did not realize, however, is that although as ambitious and as forward-looking as the project sounded, the Gigafactory was just the start of a trend towards scale in the battery making space. While Tesla’s facility was the most publicized, it would ultimately be one of many massive factories in the global pipeline.
Mastering Scale
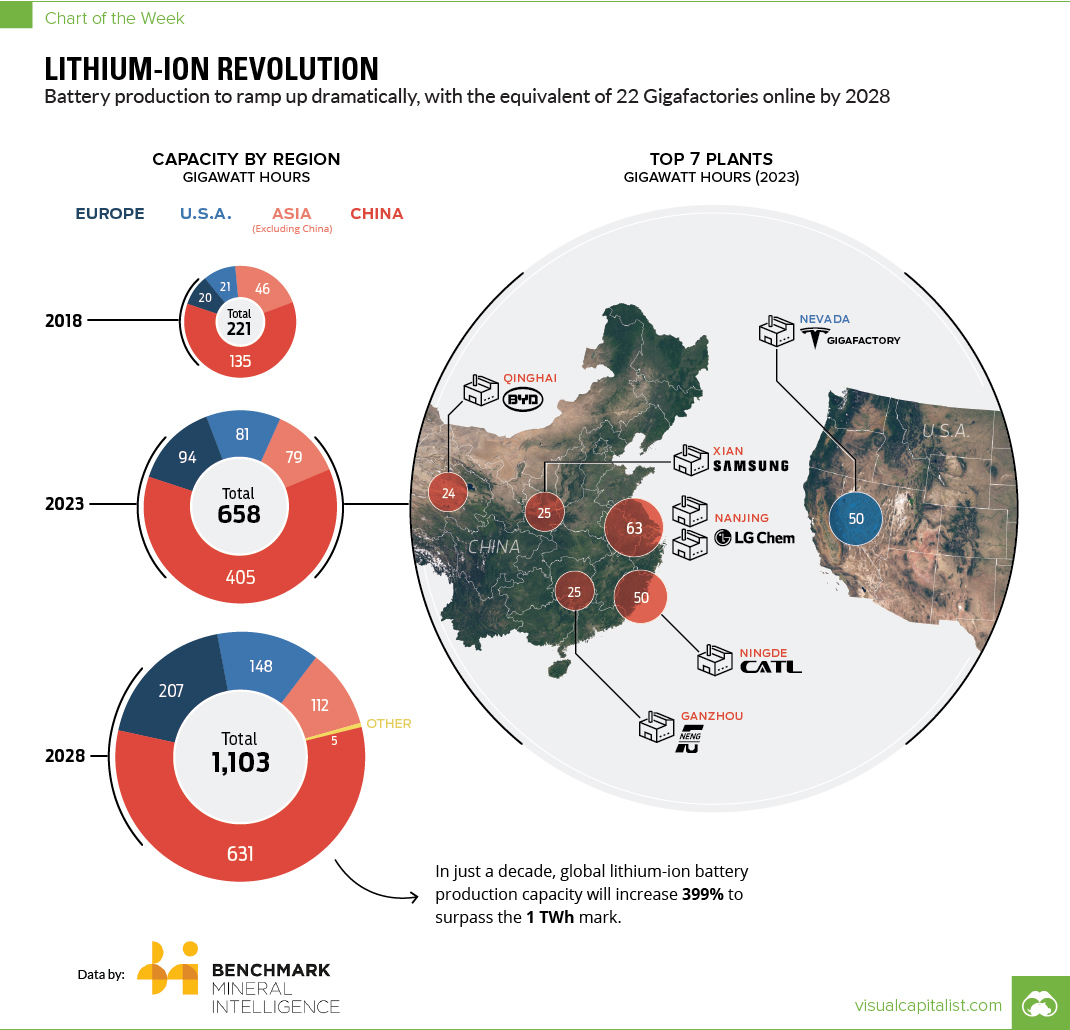
Today’s data comes to us from Benchmark Mineral Intelligence, and it forecasts that we will see a 399% increase in lithium-ion battery production capacity over the next decade – enough to pass the impressive 1 TWh milestone.
Here is a more detailed projection of how things will shape up in the coming decade:
| Region | Capacity (GWh, 2018) | Capacity (GWh, 2023) | Capacity (GWh, 2028) |
|---|---|---|---|
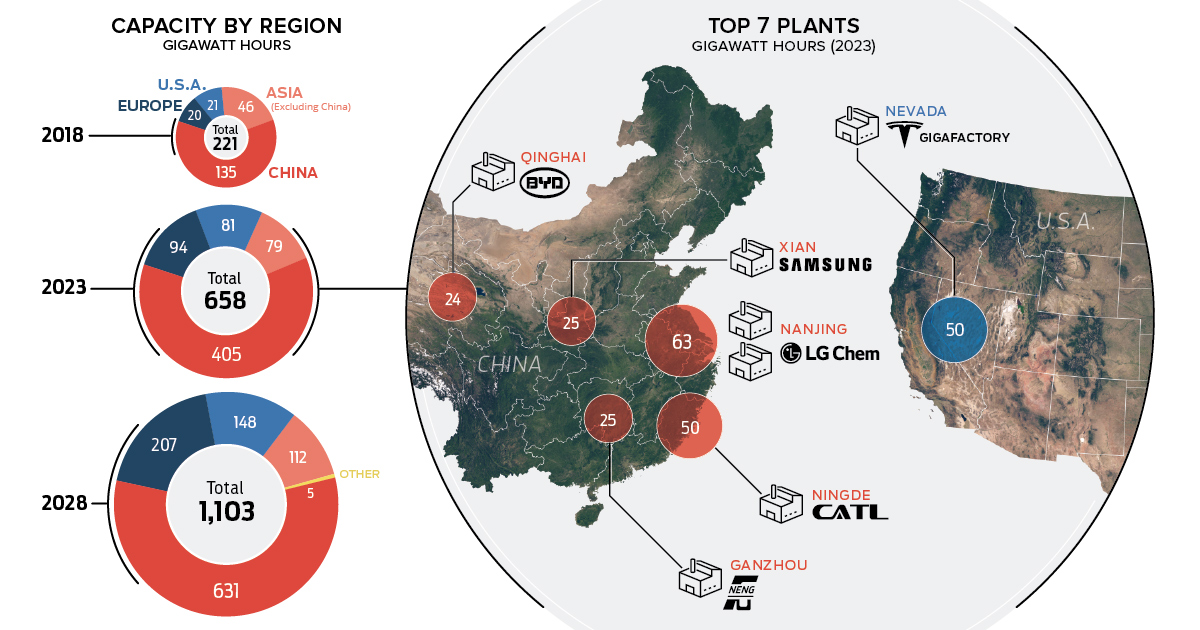
| China | 134.5 | 405 | 631 |
| Europe | 19.6 | 93.5 | 207 |
| North America | 20.9 | 81 | 148 |
| Other | 0 | 0 | 5 |
| Asia (excl China) | 45.5 | 78.5 | 111.5 |
| Grand Total | 220.5 | 658 | 1,102.5 |
In just a decade, lithium-ion battery megafactories around the world will have a combined production capacity equivalent to 22 Tesla Gigafactories!
The majority of this capacity will be located in China, which is projected to have 57% of the global total.
The Top Plants Globally
According to Benchmark, the top 10 megafactories will be combining for 299 GWh of capacity in 2023, which will be equal to almost half of the global production total.
Here are the top 10 plants, sorted by projected capacity:
| Rank | Megafactory | Owner | Country | Forecasted capacity by 2023 (GWh) |
|---|---|---|---|---|
| #1 | CATL | Contemporary Amperex Technology Co Ltd | China | 50 |
| #2 | Tesla Gigafactory 1 | Tesla Inc / Panasonic Corp (25%) | US | 50 |
| #3 | Nanjing LG Chem New Energy Battery Co., Ltd. | LG Chem | China | 35 |
| #4 | Nanjing LG Chem New Energy Battery Co., Ltd. Plant 2 | LG Chem | China | 28 |
| #5 | Samsung SDI Xian | Samsung SDI | China | 25 |
| #6 | Funeng Technology | Funeng Technology (Ganzhou) | China | 25 |
| #7 | BYD , Qinghai | BYD Co Ltd | China | 24 |
| #8 | LG Chem Wroclaw Energy Sp. z o.o. | LG Chem | Poland | 22 |
| #9 | Samsung SDI Korea | Samsung SDI | Korea | 20 |
| #10 | Lishen | TianJin Lishen Battery Joint-Stock CO.,LTD | China | 20 |
Of the top 10 megafactory plants in 2023, the majority will be located in China – meanwhile, the U.S. (Tesla Gigafactory), South Korea (Samsung), and Poland (LG Chem) will be home to the rest.
Reaching economies of scale in lithium-ion battery production will be a significant step in decreasing the overall cost of electric vehicles, which are expected to surpass traditional vehicles in market share by 2038.


Energy
The World’s Biggest Nuclear Energy Producers
China has grown its nuclear capacity over the last decade, now ranking second on the list of top nuclear energy producers.


The World’s Biggest Nuclear Energy Producers
This was originally posted on our Voronoi app. Download the app for free on Apple or Android and discover incredible data-driven charts from a variety of trusted sources.
Scientists in South Korea recently broke a record in a nuclear fusion experiment. For 48 seconds, they sustained a temperature seven times that of the sun’s core.
But generating commercially viable energy from nuclear fusion still remains more science fiction than reality. Meanwhile, its more reliable sibling, nuclear fission, has been powering our world for many decades.
In this graphic, we visualized the top producers of nuclear energy by their share of the global total, measured in terawatt hours (TWh). Data for this was sourced from the Nuclear Energy Institute, last updated in August 2022.
Which Country Generates the Most Nuclear Energy?
Nuclear energy production in the U.S. is more than twice the amount produced by China (ranked second) and France (ranked third) put together. In total, the U.S. accounts for nearly 30% of global nuclear energy output.
However, nuclear power only accounts for one-fifth of America’s electricity supply. This is in contrast to France, which generates 60% of its electricity from nuclear plants.
| Rank | Country | Nuclear Energy Produced (TWh) | % of Total |
|---|---|---|---|
| 1 | 🇺🇸 U.S. | 772 | 29% |
| 2 | 🇨🇳 China | 383 | 14% |
| 3 | 🇫🇷 France | 363 | 14% |
| 4 | 🇷🇺 Russia | 208 | 8% |
| 5 | 🇰🇷 South Korea | 150 | 6% |
| 6 | 🇨🇦 Canada | 87 | 3% |
| 7 | 🇺🇦 Ukraine | 81 | 3% |
| 8 | 🇩🇪 Germany | 65 | 2% |
| 9 | 🇯🇵 Japan | 61 | 2% |
| 10 | 🇪🇸 Spain | 54 | 2% |
| 11 | 🇸🇪 Sweden | 51 | 2% |
| 12 | 🇧🇪 Belgium | 48 | 2% |
| 13 | 🇬🇧 UK | 42 | 2% |
| 14 | 🇮🇳 India | 40 | 2% |
| 15 | 🇨🇿 Czech Republic | 29 | 1% |
| N/A | 🌐 Other | 219 | 8% |
| N/A | 🌍 Total | 2,653 | 100% |
Another highlight is how China has rapidly grown its nuclear energy capabilities in the last decade. Between 2016 and 2021, for example, it increased its share of global nuclear energy output from less than 10% to more than 14%, overtaking France for second place.
On the opposite end, the UK’s share has slipped to 2% over the same time period.
Meanwhile, Ukraine has heavily relied on nuclear energy to power its grid. In March 2022, it lost access to its key Zaporizhzhia Nuclear Power Station after Russian forces wrested control of the facility. With six 1,000 MW reactors, the plant is one of the largest in Europe. It is currently not producing any power, and has been the site of recent drone attacks.

-

 Green2 weeks ago
Ranked: Top Countries by Total Forest Loss Since 2001
-

 Travel1 week ago
Ranked: The World’s Top Flight Routes, by Revenue
-

 Technology1 week ago
Ranked: Semiconductor Companies by Industry Revenue Share
-

 Money2 weeks ago
Which States Have the Highest Minimum Wage in America?
-

 Real Estate2 weeks ago
Ranked: The Most Valuable Housing Markets in America
-

 Markets2 weeks ago
Charted: Big Four Market Share by S&P 500 Audits
-

 AI2 weeks ago
The Stock Performance of U.S. Chipmakers So Far in 2024
-

 Automotive2 weeks ago
Almost Every EV Stock is Down After Q1 2024