Energy
Battery Megafactory Forecast: 400% Increase in Capacity to 1 TWh by 2028
Battery Megafactory Forecast
The Chart of the Week is a weekly Visual Capitalist feature on Fridays.
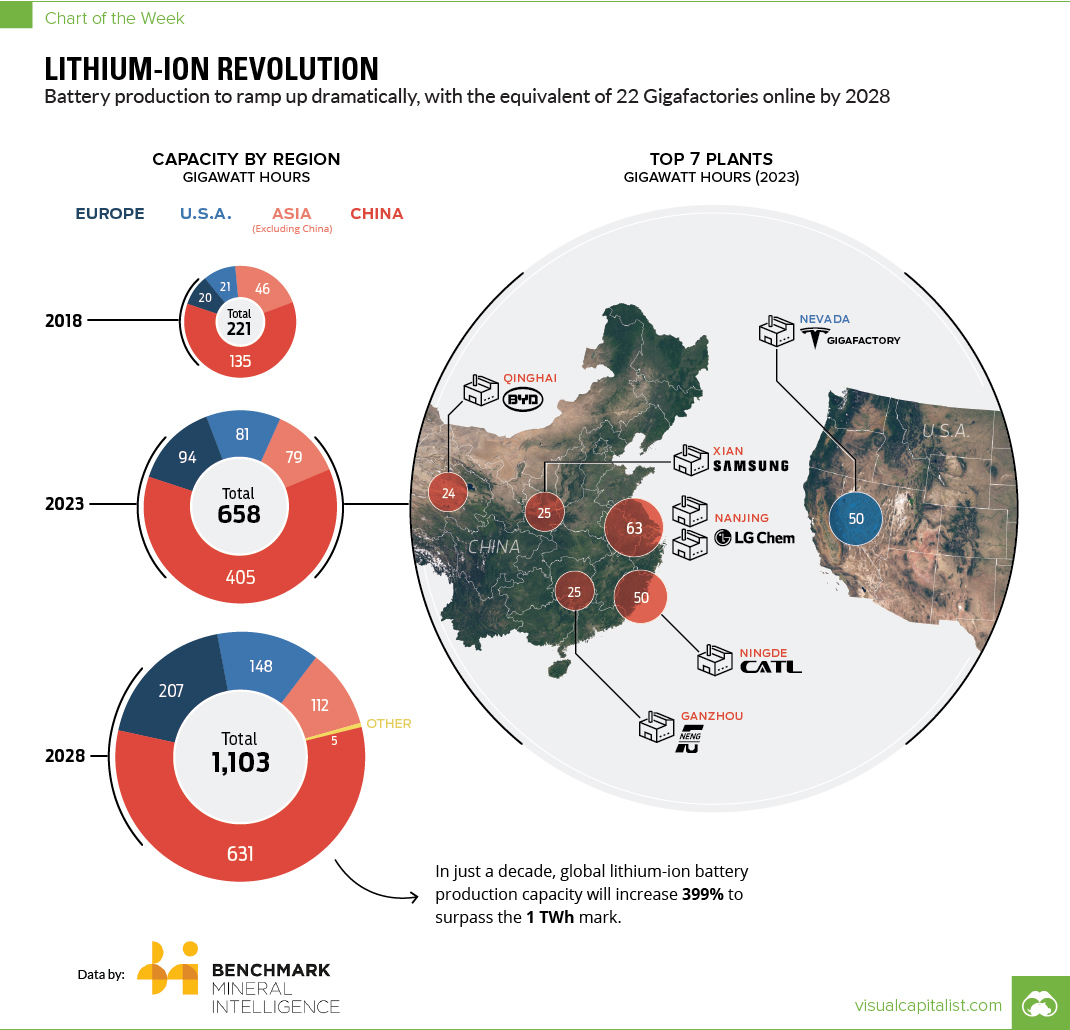
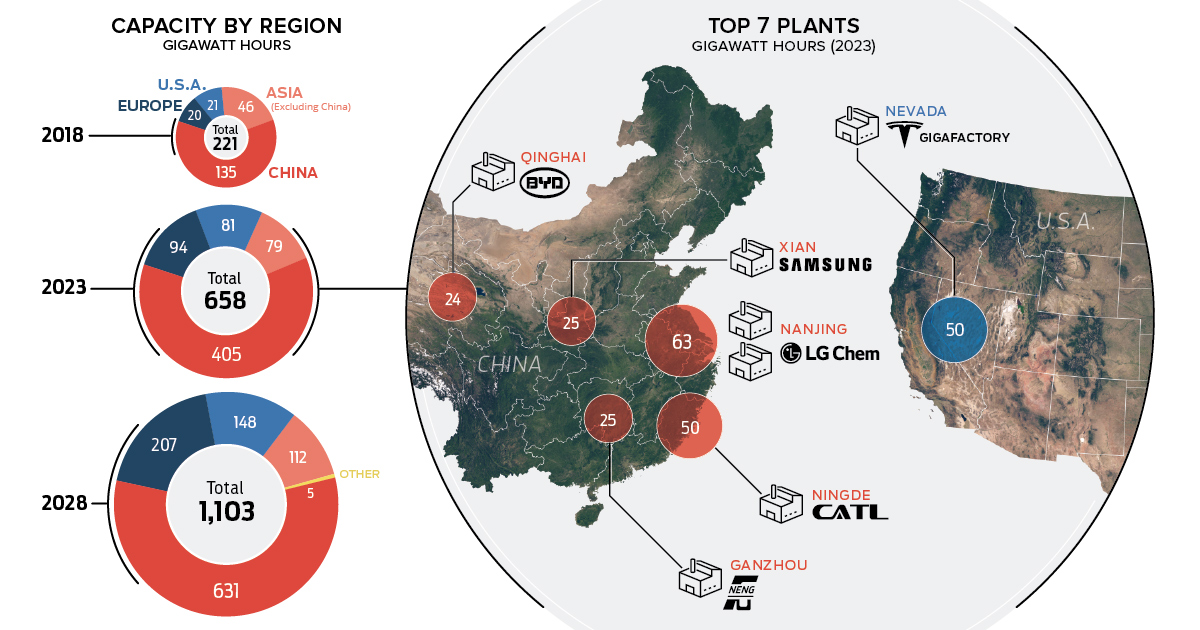
When ground broke on the massive Tesla Gigafactory in Nevada in 2014, the world marveled at the project’s audacity, size, and scope.
At the time, it was touted that the cutting-edge facility would be the largest building in the world by footprint, and that the Gigafactory would single-handedly be capable of doubling the world’s lithium-ion battery production capacity.
What many did not realize, however, is that although as ambitious and as forward-looking as the project sounded, the Gigafactory was just the start of a trend towards scale in the battery making space. While Tesla’s facility was the most publicized, it would ultimately be one of many massive factories in the global pipeline.
Mastering Scale
Today’s data comes to us from Benchmark Mineral Intelligence, and it forecasts that we will see a 399% increase in lithium-ion battery production capacity over the next decade – enough to pass the impressive 1 TWh milestone.
Here is a more detailed projection of how things will shape up in the coming decade:
| Region | Capacity (GWh, 2018) | Capacity (GWh, 2023) | Capacity (GWh, 2028) |
|---|---|---|---|
| China | 134.5 | 405 | 631 |
| Europe | 19.6 | 93.5 | 207 |
| North America | 20.9 | 81 | 148 |
| Other | 0 | 0 | 5 |
| Asia (excl China) | 45.5 | 78.5 | 111.5 |
| Grand Total | 220.5 | 658 | 1,102.5 |
In just a decade, lithium-ion battery megafactories around the world will have a combined production capacity equivalent to 22 Tesla Gigafactories!
The majority of this capacity will be located in China, which is projected to have 57% of the global total.
The Top Plants Globally
According to Benchmark, the top 10 megafactories will be combining for 299 GWh of capacity in 2023, which will be equal to almost half of the global production total.
Here are the top 10 plants, sorted by projected capacity:
| Rank | Megafactory | Owner | Country | Forecasted capacity by 2023 (GWh) |
|---|---|---|---|---|
| #1 | CATL | Contemporary Amperex Technology Co Ltd | China | 50 |
| #2 | Tesla Gigafactory 1 | Tesla Inc / Panasonic Corp (25%) | US | 50 |
| #3 | Nanjing LG Chem New Energy Battery Co., Ltd. | LG Chem | China | 35 |
| #4 | Nanjing LG Chem New Energy Battery Co., Ltd. Plant 2 | LG Chem | China | 28 |
| #5 | Samsung SDI Xian | Samsung SDI | China | 25 |
| #6 | Funeng Technology | Funeng Technology (Ganzhou) | China | 25 |
| #7 | BYD , Qinghai | BYD Co Ltd | China | 24 |
| #8 | LG Chem Wroclaw Energy Sp. z o.o. | LG Chem | Poland | 22 |
| #9 | Samsung SDI Korea | Samsung SDI | Korea | 20 |
| #10 | Lishen | TianJin Lishen Battery Joint-Stock CO.,LTD | China | 20 |
Of the top 10 megafactory plants in 2023, the majority will be located in China – meanwhile, the U.S. (Tesla Gigafactory), South Korea (Samsung), and Poland (LG Chem) will be home to the rest.
Reaching economies of scale in lithium-ion battery production will be a significant step in decreasing the overall cost of electric vehicles, which are expected to surpass traditional vehicles in market share by 2038.


Energy
Charted: 4 Reasons Why Lithium Could Be the Next Gold Rush
Visual Capitalist has partnered with EnergyX to show why drops in prices and growing demand may make now the right time to invest in lithium.


4 Reasons Why You Should Invest in Lithium
Lithium’s importance in powering EVs makes it a linchpin of the clean energy transition and one of the world’s most precious minerals.
In this graphic, Visual Capitalist partnered with EnergyX to explore why now may be the time to invest in lithium.
1. Lithium Prices Have Dropped
One of the most critical aspects of evaluating an investment is ensuring that the asset’s value is higher than its price would indicate. Lithium is integral to powering EVs, and, prices have fallen fast over the last year:
| Date | LiOH·H₂O* | Li₂CO₃** |
|---|---|---|
| Feb 2023 | $76 | $71 |
| March 2023 | $71 | $61 |
| Apr 2023 | $43 | $33 |
| May 2023 | $43 | $33 |
| June 2023 | $47 | $45 |
| July 2023 | $44 | $40 |
| Aug 2023 | $35 | $35 |
| Sept 2023 | $28 | $27 |
| Oct 2023 | $24 | $23 |
| Nov 2023 | $21 | $21 |
| Dec 2023 | $17 | $16 |
| Jan 2024 | $14 | $15 |
| Feb 2024 | $13 | $14 |
Note: Monthly spot prices were taken as close to the 14th of each month as possible.
*Lithium hydroxide monohydrate MB-LI-0033
**Lithium carbonate MB-LI-0029
2. Lithium-Ion Battery Prices Are Also Falling
The drop in lithium prices is just one reason to invest in the metal. Increasing economies of scale, coupled with low commodity prices, have caused the cost of lithium-ion batteries to drop significantly as well.
In fact, BNEF reports that between 2013 and 2023, the price of a Li-ion battery dropped by 82%.
| Year | Price per KWh |
|---|---|
| 2023 | $139 |
| 2022 | $161 |
| 2021 | $150 |
| 2020 | $160 |
| 2019 | $183 |
| 2018 | $211 |
| 2017 | $258 |
| 2016 | $345 |
| 2015 | $448 |
| 2014 | $692 |
| 2013 | $780 |

3. EV Adoption is Sustainable
One of the best reasons to invest in lithium is that EVs, one of the main drivers behind the demand for lithium, have reached a price point similar to that of traditional vehicle.
According to the Kelly Blue Book, Tesla’s average transaction price dropped by 25% between 2022 and 2023, bringing it in line with many other major manufacturers and showing that EVs are a realistic transport option from a consumer price perspective.
| Manufacturer | September 2022 | September 2023 |
|---|---|---|
| BMW | $69,000 | $72,000 |
| Ford | $54,000 | $56,000 |
| Volkswagon | $54,000 | $56,000 |
| General Motors | $52,000 | $53,000 |
| Tesla | $68,000 | $51,000 |
4. Electricity Demand in Transport is Growing
As EVs become an accessible transport option, there’s an investment opportunity in lithium. But possibly the best reason to invest in lithium is that the IEA reports global demand for the electricity in transport could grow dramatically by 2030:
| Transport Type | 2022 | 2025 | 2030 |
|---|---|---|---|
| Buses 🚌 | 23,000 GWh | 50,000 GWh | 130,000 GWh |
| Cars 🚙 | 65,000 GWh | 200,000 GWh | 570,000 GWh |
| Trucks 🛻 | 4,000 GWh | 15,000 GWh | 94,000 GWh |
| Vans 🚐 | 6,000 GWh | 16,000 GWh | 72,000 GWh |
The Lithium Investment Opportunity
Lithium presents a potentially classic investment opportunity. Lithium and battery prices have dropped significantly, and recently, EVs have reached a price point similar to other vehicles. By 2030, the demand for clean energy, especially in transport, will grow dramatically.
With prices dropping and demand skyrocketing, now is the time to invest in lithium.
EnergyX is poised to exploit lithium demand with cutting-edge lithium extraction technology capable of extracting 300% more lithium than current processes.

-

 Lithium3 days ago
Ranked: The Top 10 EV Battery Manufacturers in 2023
Asia dominates this ranking of the world’s largest EV battery manufacturers in 2023.
-

 Energy1 week ago
The World’s Biggest Nuclear Energy Producers
China has grown its nuclear capacity over the last decade, now ranking second on the list of top nuclear energy producers.
-

 Energy4 weeks ago
The World’s Biggest Oil Producers in 2023
Just three countries accounted for 40% of global oil production last year.
-

 Energy1 month ago
How Much Does the U.S. Depend on Russian Uranium?
Currently, Russia is the largest foreign supplier of nuclear power fuel to the U.S.
-

 Uranium2 months ago
Charted: Global Uranium Reserves, by Country
We visualize the distribution of the world’s uranium reserves by country, with 3 countries accounting for more than half of total reserves.
-

 Energy3 months ago
Visualizing the Rise of the U.S. as Top Crude Oil Producer
Over the last decade, the United States has established itself as the world’s top producer of crude oil, surpassing Saudi Arabia and Russia.


-

 Mining1 week ago
Gold vs. S&P 500: Which Has Grown More Over Five Years?
-

 Markets2 weeks ago
Ranked: The Most Valuable Housing Markets in America
-

 Money2 weeks ago
Which States Have the Highest Minimum Wage in America?
-

 AI2 weeks ago
Ranked: Semiconductor Companies by Industry Revenue Share
-

 Markets2 weeks ago
Ranked: The World’s Top Flight Routes, by Revenue
-

 Countries2 weeks ago
Population Projections: The World’s 6 Largest Countries in 2075
-

 Markets2 weeks ago
The Top 10 States by Real GDP Growth in 2023
-

 Demographics2 weeks ago
The Smallest Gender Wage Gaps in OECD Countries