Misc
Visualizing the Average Commute Time in U.S. States and Cities
View a high resolution version of this graphic
Average Commute Time in U.S. States and Cities
View the high resolution version of today’s graphic by clicking here.
The average person is awake for 15.5 hours per day, but once you subtract hours committed to work, eating, chores, personal care, and errands, there’s only so little much free time leftover.
That’s why the amount of time spent commuting, either in a car or via transit, can be a massive difference maker towards a person’s quality of life.
The Average Commute
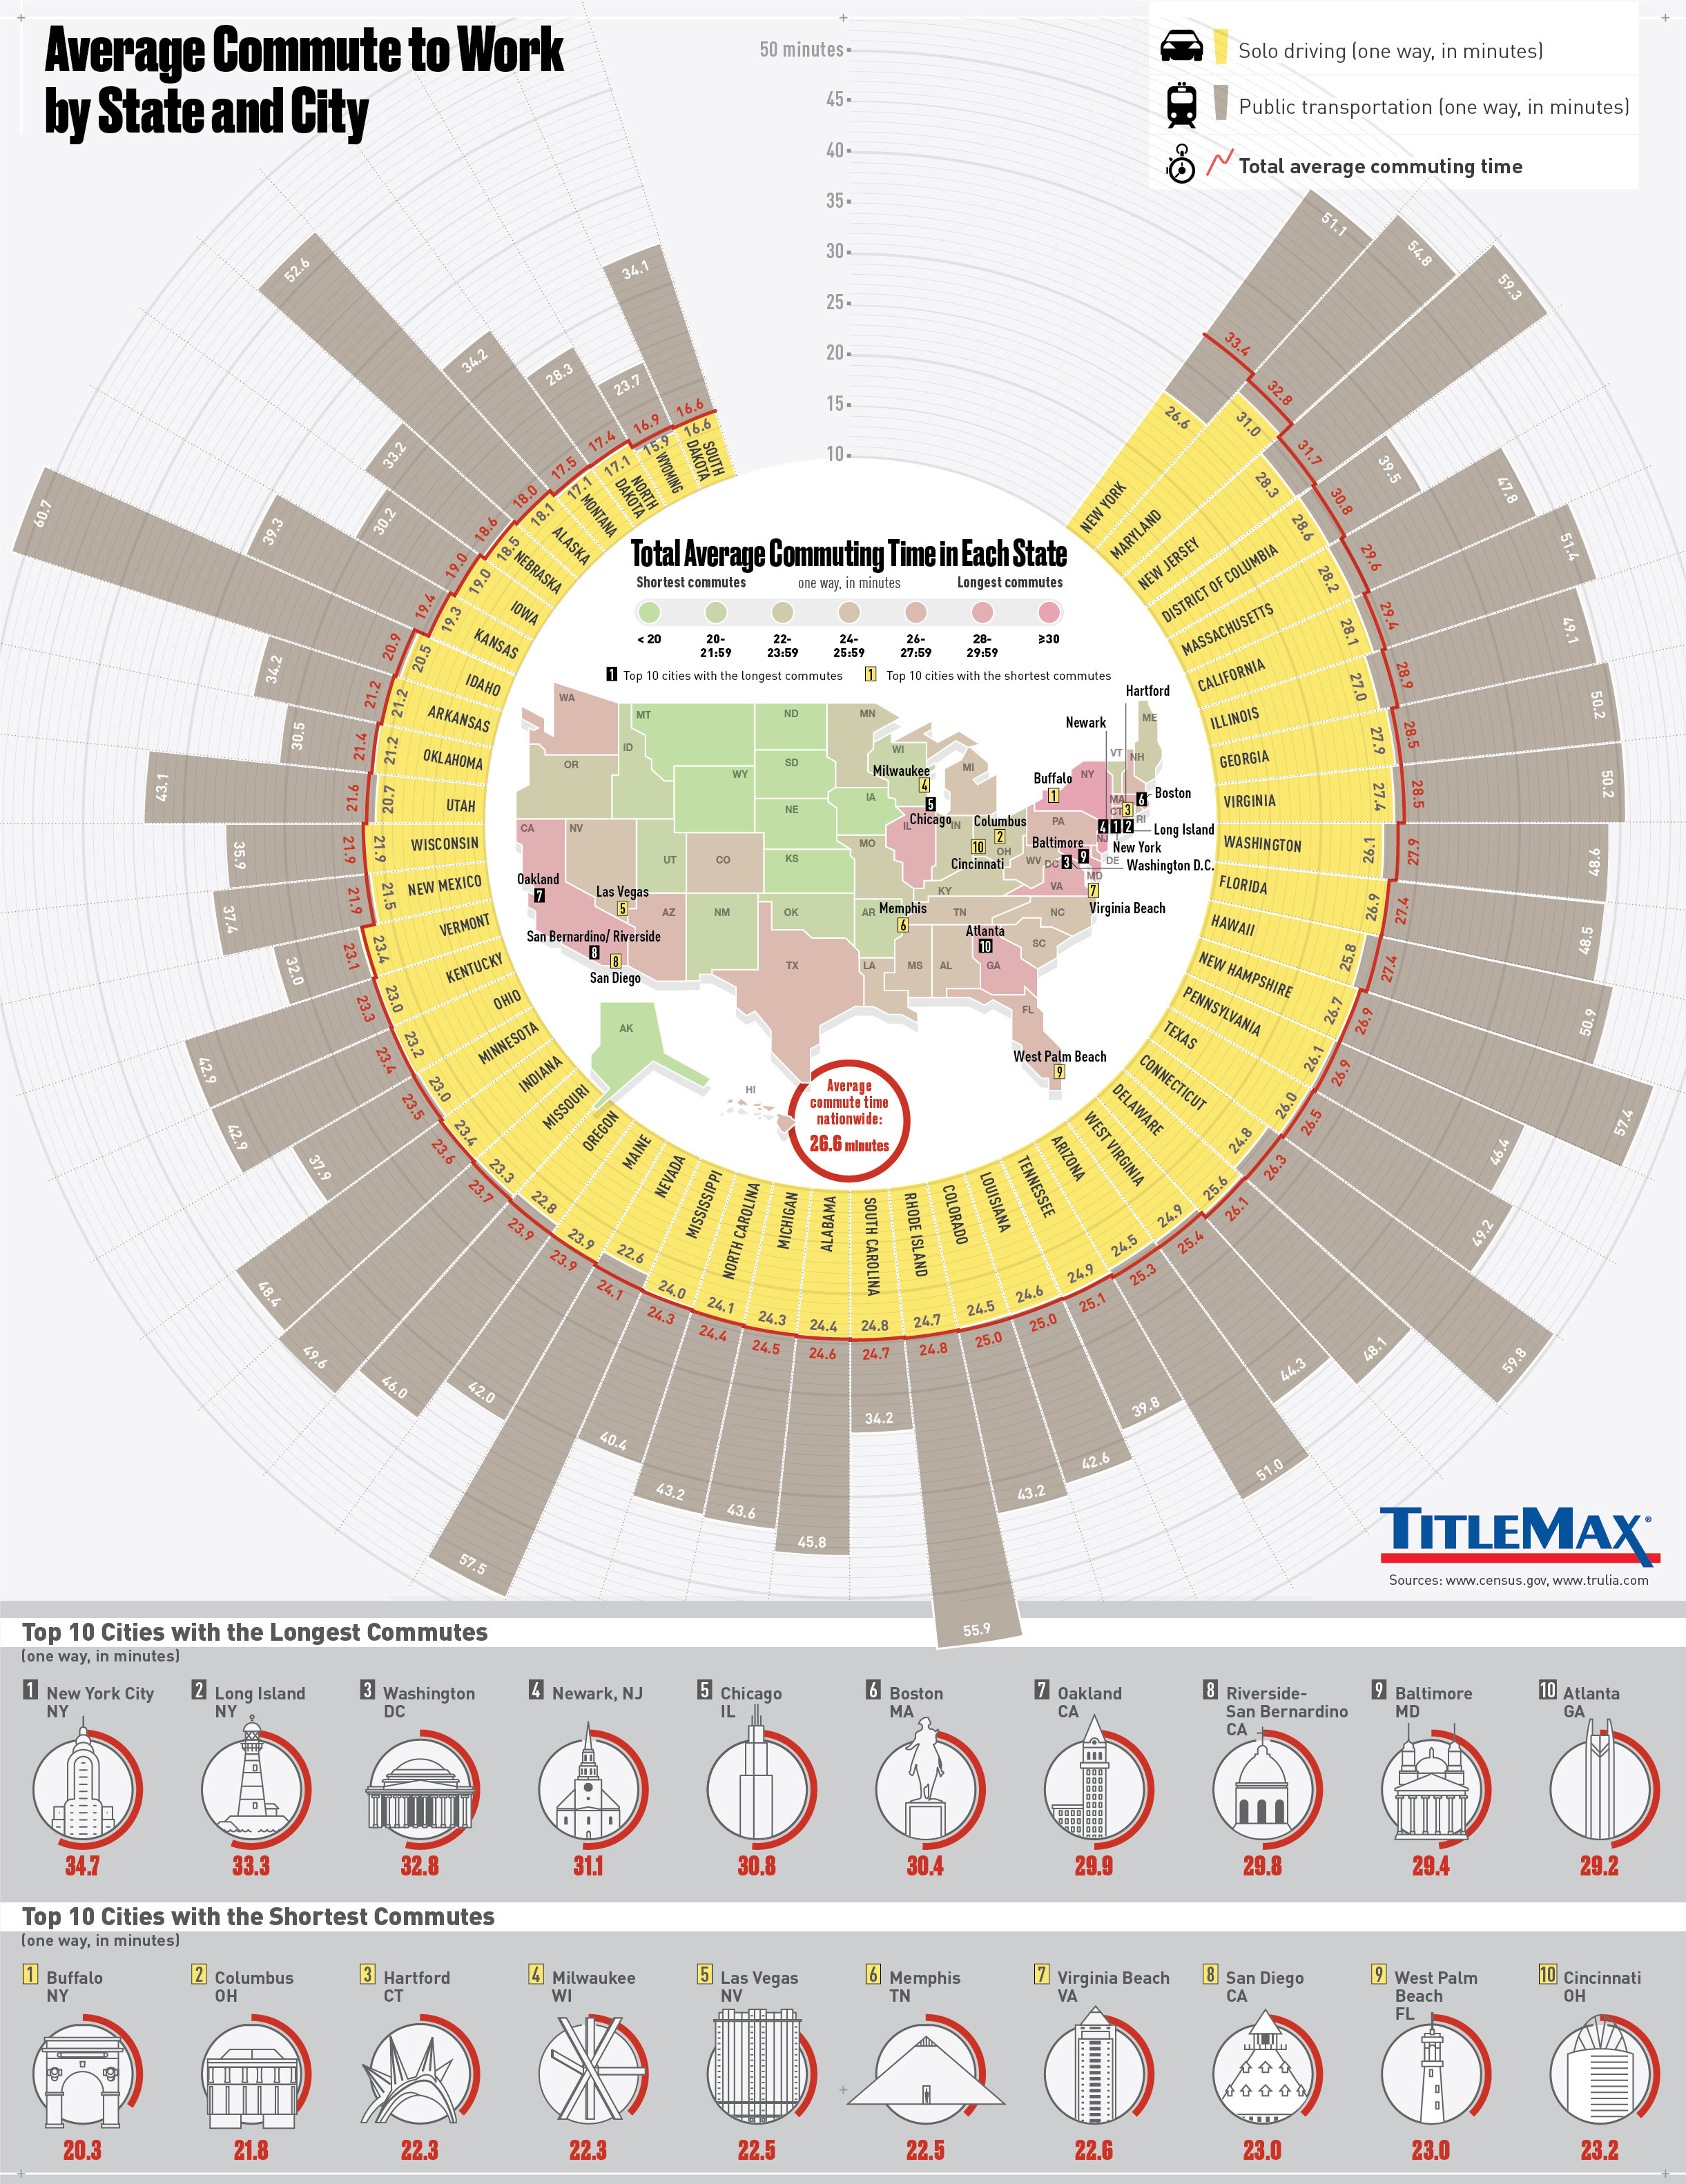
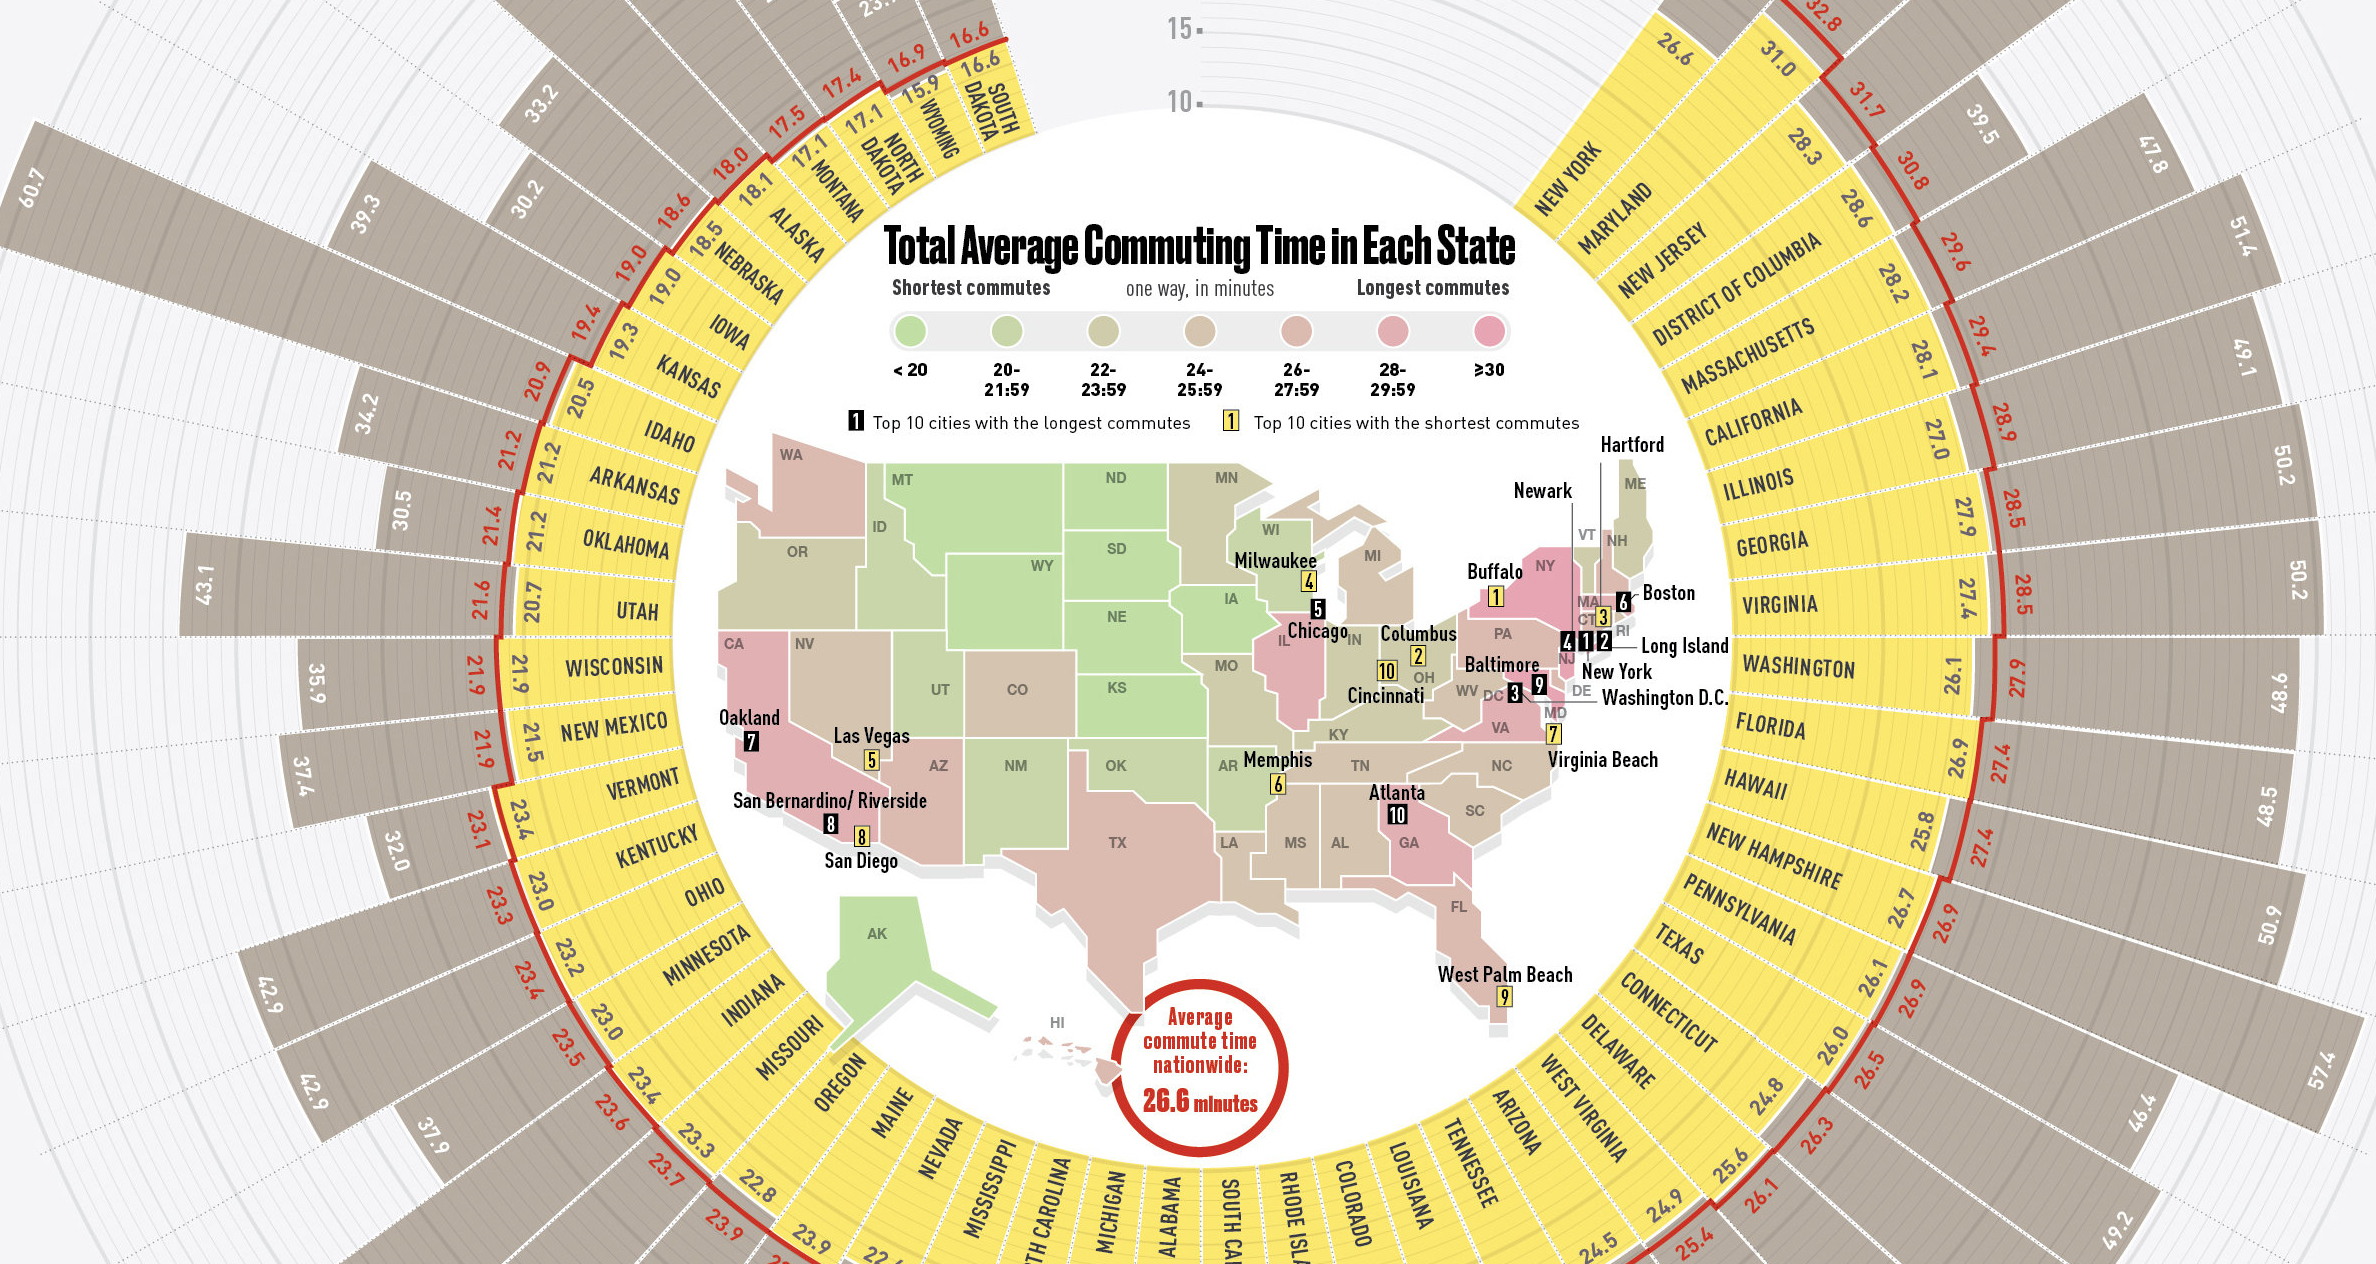
Throughout the United States, the average commute time works out to about 26 minutes one-way.
However, as today’s infographic from TitleMax shows, the average commute varies considerably between individual states, and also between major cities as well.
In South Dakota, a state with fewer than one million people, congestion is not a problem for most. The state is home to the shortest average commute in the country at just 16.6 minutes one-way.
Meanwhile, as you may imagine, New York is the polar opposite of South Dakota for getting to work. The Empire State has the longest average commute in the country, which is double the length at 33.6 minutes.
Commutes by City
Every city is different, which means that data can have high amounts of variability within each state.
New York again is a great example for this: NYC has the longest average commute in the nation at 34.7 minutes, but go upstate and Buffalo actually has the shortest average commute for all major cities at 20.3 minutes per trip.
Here are the 10 shortest commutes in the country, for major cities:
| Rank | City | State or District | Avg. Commute (Mins) |
|---|---|---|---|
| #1 | Buffalo | NY | 20.3 |
| #2 | Columbus | OH | 21.8 |
| #3 | Hartford | CT | 22.3 |
| #4 | Milwaukee | WI | 22.3 |
| #5 | Las Vegas | NV | 22.5 |
| #6 | Memphis | TN | 22.5 |
| #7 | Virginia Beach | VA | 22.6 |
| #8 | San Diego | CA | 23.0 |
| #9 | West Palm Beach | FL | 23.0 |
| #10 | Cincinnati | OH | 23.2 |
Many people living in places like Buffalo or San Diego are able to hop to their place of the work in 20 minutes or less, giving them a little extra flexibility with their free time in comparison to bigger cities in the country.
Here are the 10 longest commutes in the country, for major cities:
| Rank | City | State or District | Avg. Commute (Mins) |
|---|---|---|---|
| #1 | New York City | NY | 34.7 |
| #2 | Long Island | NY | 33.3 |
| #3 | Washington | DC | 32.8 |
| #4 | Newark | NJ | 31.1 |
| #5 | Chicago | IL | 30.8 |
| #6 | Boston | MA | 30.4 |
| #7 | Oakland | CA | 29.9 |
| #8 | Riverside-San Bernardino | CA | 29.8 |
| #9 | Baltimore | MD | 29.4 |
| #10 | Atlanta | GA | 29.2 |
While it’s surprising to see that Los Angeles didn’t make it onto the list of cities with ultra-long commutes, the largest city in California does have the distinction of being the most congested city in the world.
It’s there that citizens spend an unfortunate 104 hours each year stuck in traffic jams.


VC+
VC+: Get Our Key Takeaways From the IMF’s World Economic Outlook
A sneak preview of the exclusive VC+ Special Dispatch—your shortcut to understanding IMF’s World Economic Outlook report.

Have you read IMF’s latest World Economic Outlook yet? At a daunting 202 pages, we don’t blame you if it’s still on your to-do list.
But don’t worry, you don’t need to read the whole April release, because we’ve already done the hard work for you.
To save you time and effort, the Visual Capitalist team has compiled a visual analysis of everything you need to know from the report—and our upcoming VC+ Special Dispatch will be available exclusively to VC+ members on Thursday, April 25th.
If you’re not already subscribed to VC+, make sure you sign up now to receive the full analysis of the IMF report, and more (we release similar deep dives every week).
For now, here’s what VC+ members can expect to receive.
Your Shortcut to Understanding IMF’s World Economic Outlook
With long and short-term growth prospects declining for many countries around the world, this Special Dispatch offers a visual analysis of the key figures and takeaways from the IMF’s report including:
- The global decline in economic growth forecasts
- Real GDP growth and inflation forecasts for major nations in 2024
- When interest rate cuts will happen and interest rate forecasts
- How debt-to-GDP ratios have changed since 2000
- And much more!

Get the Full Breakdown in the Next VC+ Special Dispatch
VC+ members will receive the full Special Dispatch on Thursday, April 25th.
Make sure you join VC+ now to receive exclusive charts and the full analysis of key takeaways from IMF’s World Economic Outlook.
Don’t miss out. Become a VC+ member today.
What You Get When You Become a VC+ Member
VC+ is Visual Capitalist’s premium subscription. As a member, you’ll get the following:
- Special Dispatches: Deep dive visual briefings on crucial reports and global trends
- Markets This Month: A snappy summary of the state of the markets and what to look out for
- The Trendline: Weekly curation of the best visualizations from across the globe
- Global Forecast Series: Our flagship annual report that covers everything you need to know related to the economy, markets, geopolitics, and the latest tech trends
- VC+ Archive: Hundreds of previously released VC+ briefings and reports that you’ve been missing out on, all in one dedicated hub
You can get all of the above, and more, by joining VC+ today.

-

 Markets1 week ago
U.S. Debt Interest Payments Reach $1 Trillion
-

 Business2 weeks ago
Charted: Big Four Market Share by S&P 500 Audits
-

 Markets2 weeks ago
Ranked: The Most Valuable Housing Markets in America
-

 Money2 weeks ago
Which States Have the Highest Minimum Wage in America?
-

 AI2 weeks ago
Ranked: Semiconductor Companies by Industry Revenue Share
-

 Markets2 weeks ago
Ranked: The World’s Top Flight Routes, by Revenue
-

 Demographics2 weeks ago
Population Projections: The World’s 6 Largest Countries in 2075
-

 Markets2 weeks ago
The Top 10 States by Real GDP Growth in 2023