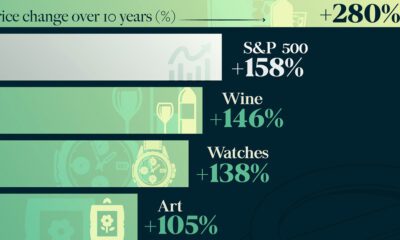

How does investing in luxury goods like expensive watches and rare whisky compare to other goods, or to the S&P 500?


From athletes and musicians to actors and celebrity personalities, here are the top 10 most followed people on Instagram.
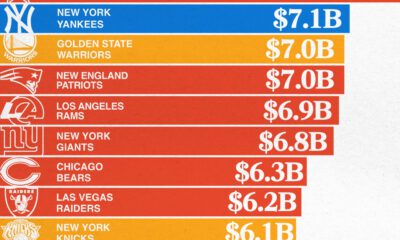

The most valuable sports teams in 2024 range from NBA and MLB teams to renowned soccer clubs in Europe, but the NFL reigned supreme.
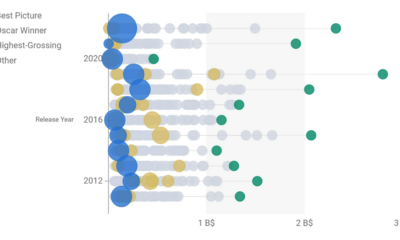

This data-driven exploration examines the relationship between Best Picture Oscar winners and box office performance over the past 30 years.
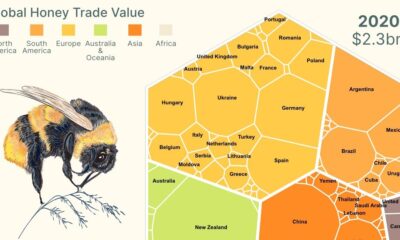

This infographic breaks down global honey exports and shows the power of Mānuka honey exports from New Zealand.


There are over 600,000 individuals worldwide with a net worth surpassing $30 million, representing the wealthiest people on the planet. Here's where they live.


Will the global economy be stronger in 2024 than in 2023?


European hubs top the list, with Monaco requiring $12.9 million to join the top 1% club.
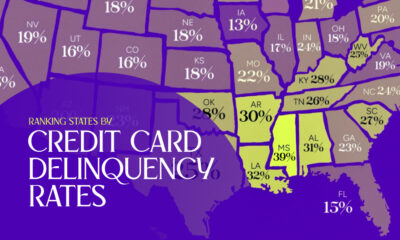

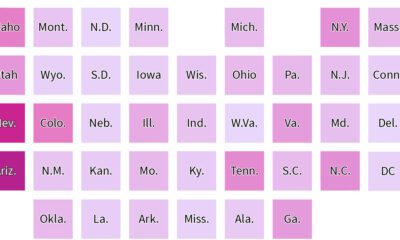
Which states have the lowest credit card delinquency rates in America, and which have the highest?


Here are the top languages spoken in the world by number of speakers in 2023.
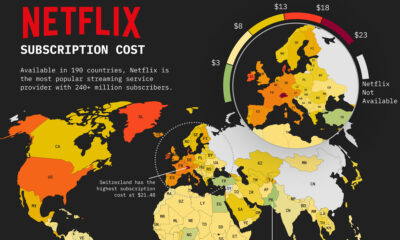

This map of Netflix price by country shows how much a basic subscription package costs around the world.


We chart the ever-widening gap between median incomes and the median price of houses in America, using data from the Federal Reserve from 1984 to 2022.


It's election year around the world, and this map of 2024 global elections by country shows just how many people will be impacted.


Over the last decade, the United States has established itself as the world's top producer of crude oil, surpassing Saudi Arabia and Russia.

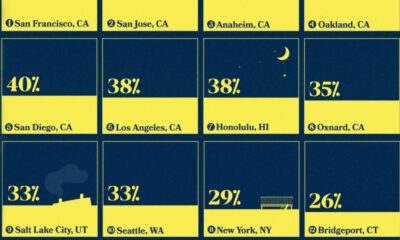
Visualizing the least affordable U.S. cities for renters by the percentage of affordable rentals available on an average salary.


This graphic illustrates Panama Canal traffic by shipment category, looking at the total number of shipping crossings and the total tonnage.


This graphic visualizes the most valuable brands by country in 12 major economies, from tech and energy giants to automakers and banks.
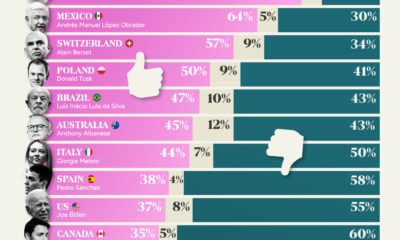

This chart highlights the approval ratings of world leaders in 2024, showing how the citizens of major countries feel about their leaders.
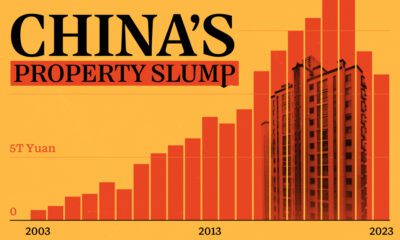

These charts show China's real estate boom in the 21st century and the subsequent slowdown since 2022.


The U.S. might have a median age of 39, but the median age by state ranges from the low 30s to the mid 40s.
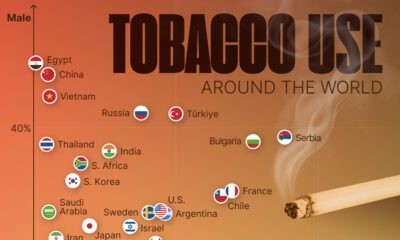

This visual shows tobacco use by country and sex, highlighting which countries still have a high prevalence of smoking.

Where does the internet live? This graphic highlights the biggest data center markets in the world by electricity consumption.


What are the top retirement planning mistakes people make? Here are the top 10 common mistakes to avoid as seen by financial professionals.


This infographic ranks the 20 most popular neighborhoods in the U.S. for homebuyers based on search interest.
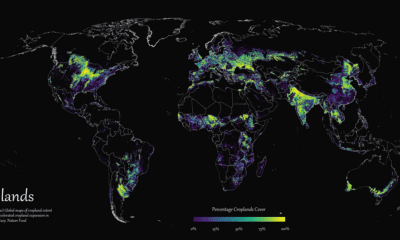

Where are the world's croplands located? This detailed map highlights the world’s cropland cover as of 2019.
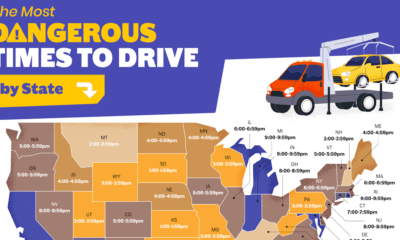

When is the most dangerous time to drive on American roads? We break down the data by hour, day, month, and state.
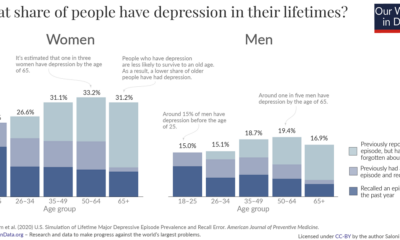

These graphics reveal how many people get depression over the course of their lives, broken down by age and sex.
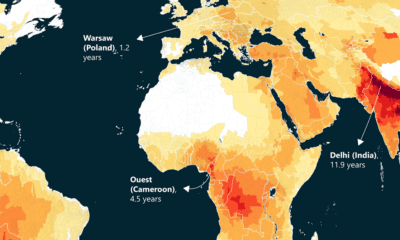

This world map of life expectancy gains shows how much longer people could potentially live by reducing pollution.


What were the top data visualizations on Visual Capitalist in 2023? We highlight the best charts, maps, and infographics from the year.

We highlight the top 15 U.S. metro areas by their percentage of million-dollar homes, from San Francisco to Miami.
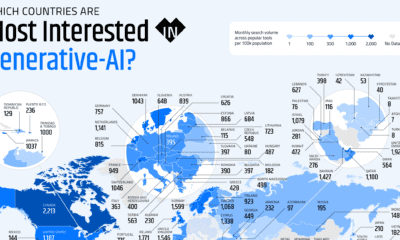

These graphics highlight interest in generative AI by country, covering interest in text, image, video, or audio generation.


Which economies are expected to see interest rates rise, or fall? We highlight IMF forecasts for international interest rates through 2028.

Which countries export, and import, the most coffee? This visual highlights the global coffee trade by export flows in 2019.
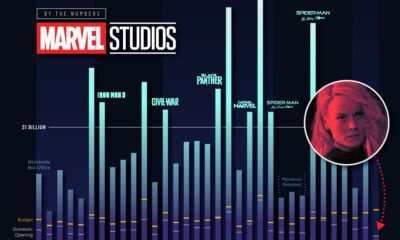

How poorly did 'The Marvels' perform in its opening weekend, and how do other Marvel box office returns compare?
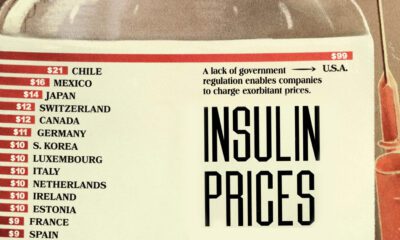

This visual highlights the cost of insulin by country, showing how much more expensive diabetes medicine is in the U.S.
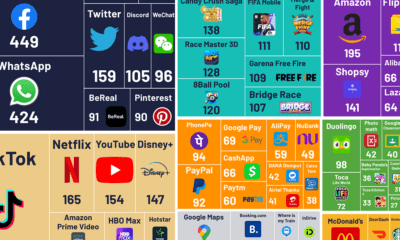

What are the world's most popular apps? This graphic visualizes the most downloaded apps, grouped together by different categories.


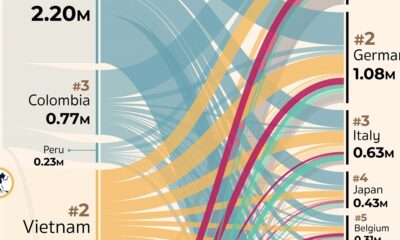
More than 45 million American residents were immigrants in 2021, having moved for various reasons.
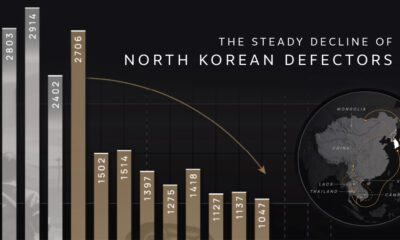

Why are the number of North Korean defectors decreasing? We cover the number of defectors by year and map their perilous escape routes.
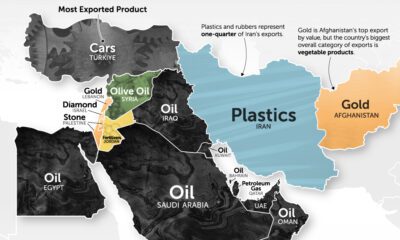

It's more than just oil. This map of Middle East exports shows the top global product of each country by value.


What costumes are kids, adults, and pets dressing up as this year? Here we visualize the most popular Halloween costumes in the U.S. in 2023.

Over 700,000 Californians moved from the Golden State to other parts of U.S. between 2020–21. But where did they go?


We chart current and effective retirement ages for 45 countries, revealing some stark regional differences.
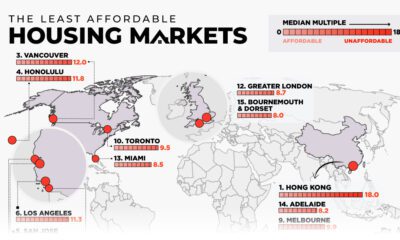

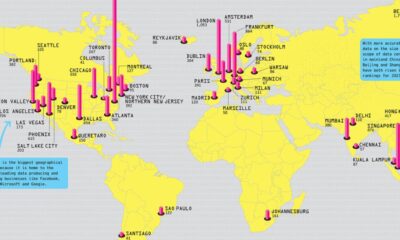
This map examines middle-income housing market affordability across eight major countries, highlighting some of the least affordable cities.
Antarctica's ice extent has reached record lows. This visual details and maps Antarctica sea ice loss over the last two years.
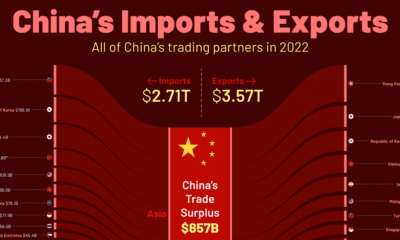

China trades with more than 200 countries globally. Here's how China's trade partners break down by import and export destinations.
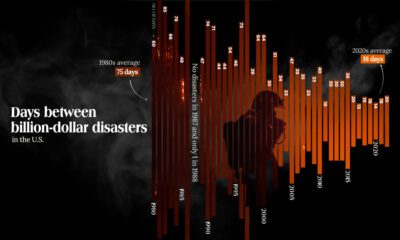

The Maui fire is the latest of many disasters in the U.S. And data shows that frequency of costly weather disasters has increased.
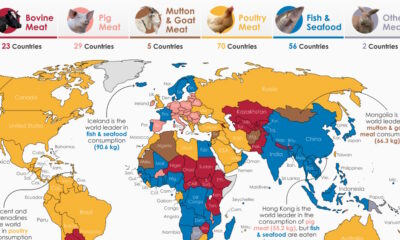

By examining meat consumption by country, we uncover regional differences in how much, and what type of meat people around the world prefer.
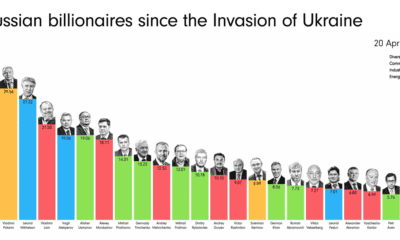

How have Russian billionaires fared since Russia's invasion of Ukraine? This animation tracks the wealth of 22 Russian billionaires.
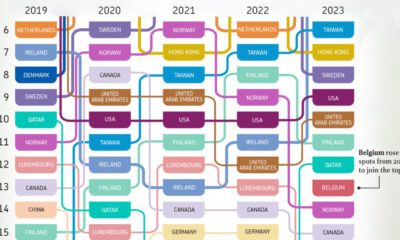

What are the most competitive countries when it comes to business? This visual highlights the top 20 economies over the last five years.


How do you visualize trade? These 9 graphics on the topic are the shortlist winners of our inaugural Creator Program Challenge.


 Creator Program