

This month, we dive into bonus content from our new Generational Power Index, as well as topical visualizations in the news.

This month, we introduce three new features, and bring back 'The News in Charts', looking at topical visualizations in the news.


VC Elements is a brand new channel brought to you by Visual Capitalist which uses data-driven visuals to bridge the gap between the global trends shaping our...

This month, we'll be looking at everything Warren Buffett, topical visuals in the news, and also graphics for International Women's Day.
We're launching our first features on how we find inspiration, as well as uncovering charts in the news. Also, our usual data-driven visuals.


Use the powerful infographics, charts, and data visualizations created by Visual Capitalist to anchor your next story, publication, or report.

Upcoming features on VC+ in the next month include the Best of Trendline, as well as a crystal ball into future trends.


Coming to our VC+ members in December: the Evolution of VC Visuals, a brand new 'Retrospective' feature, and more!


We’ve pulled together 6 reasons why our new coffee table style book Signals is the perfect gift to inspire and encourage this holiday season.

Our new data-driven book, identifies clear takeaways—called ‘signals’— that are shaping the future of the global economy.


Coming to our VC+ members in November: an exclusive Signals webinar, a brand new Overhead Insights feature, and more!
From October 22nd to 29th, we’re asking our valued audience members to complete a quick survey, to help shape the future of Visual Capitalist. This in...
If you’re a regular visitor to Visual Capitalist, you know that we’re your home base for data-driven, visual storytelling that helps explain a complex world. But...
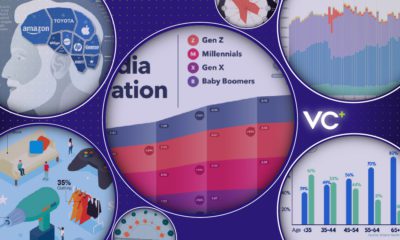

Coming to our VC+ members in September: infographics on generational differences, a preview of chapters for our new book, and more!
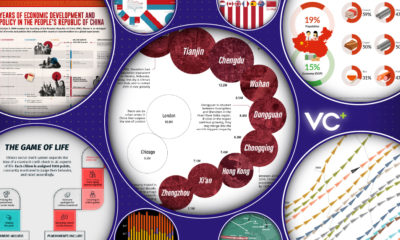

Upcoming member features include a focus on China, cities, and global demographics — and of course, our weekly Trendline dispatch.


Upcoming content on VC+, the premium members program of Visual Capitalist.
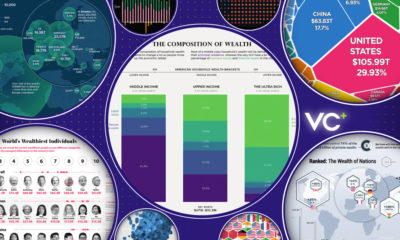

This month on VC+: The Trendline, our best infographics on wealth, a new monthly special dispatch, and we reveal the first chapter from our new book.


