

Korean brands dominate the U.S. TV market.


From MicroStrategy to Tesla, this graphic shows who holds the most bitcoins globally across corporate companies.


We visualized the results of an analysis by the World Economic Forum, which uncovered the jobs most impacted by AI.


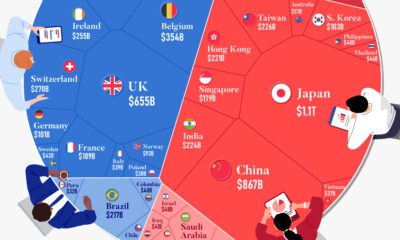
This graphic illustrates the biggest stock markets by country, providing a unique breakdown of $110 trillion in valuation.


Will the global economy be stronger in 2024 than in 2023?


European hubs top the list, with Monaco requiring $12.9 million to join the top 1% club.


It's election year around the world, and this map of 2024 global elections by country shows just how many people will be impacted.


Over the last decade, the United States has established itself as the world's top producer of crude oil, surpassing Saudi Arabia and Russia.


In 2023, iPhones accounted for more than half of Apple's revenue.


This graphic illustrates Panama Canal traffic by shipment category, looking at the total number of shipping crossings and the total tonnage.
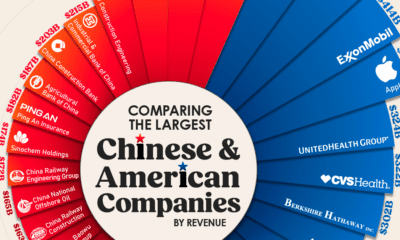

China's largest company, the utility giant State Grid, ranks as the world's third-largest company by revenue, trailing only Walmart and Saudi Aramco.


China holds the position of both the top importer and exporter with MENA countries by volume.


Uranium production is concentrated in a few countries worldwide. This graphic shows the top producers globally since 1945.
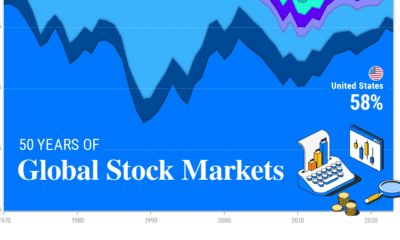

This graphic shows the evolution of global stock markets over modern history—highlighting the outsized influence of the U.S. market.
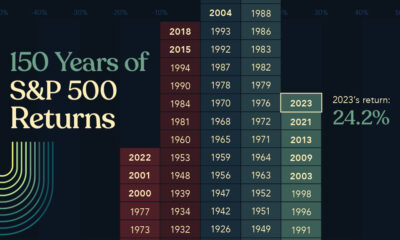

Last year, U.S. stocks took investors by surprise. This graphic shows S&P 500 historical returns since 1875 to put 2023 returns into context.
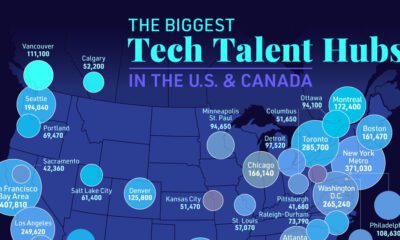

San Francisco and New York may be known as top tech talent hubs, but other cities are experiencing rapid growth in their tech labor pools.
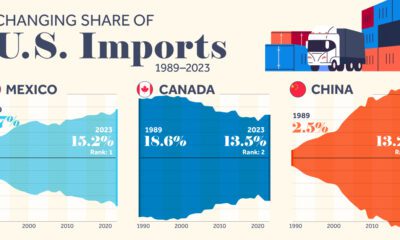

We highlight seven key U.S. trade partners and their changing share in the sources of U.S. imports from 1989–2023.
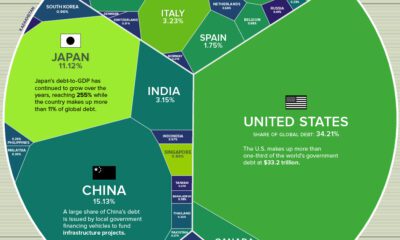

Global debt has soared since the pandemic. Which countries have the biggest stockpile of debt outstanding in 2023?
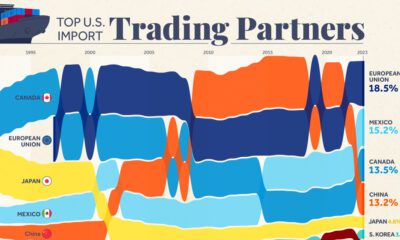

Nearly 60% of U.S. imports came from just four trade entities in 2023. We rank the top U.S. trading partners and show their growth over time.


This infographic visualizes the 2.8 billion tonnes of metals mined in 2022.


More than 45 million American residents were immigrants in 2021, having moved for various reasons.


In this graphic, we take a look at the recent U.S. mortgage rate surge, and how the 30-year fixed-rate mortgage has evolved since 2013.
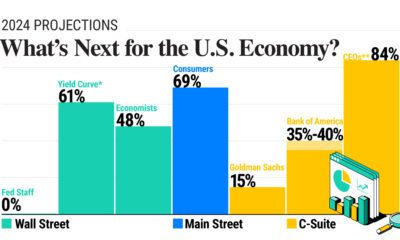

In this graphic, we show the probability of a U.S. recession in 2024, based on forecasts from Wall Street, Main Street, and the C-Suite.
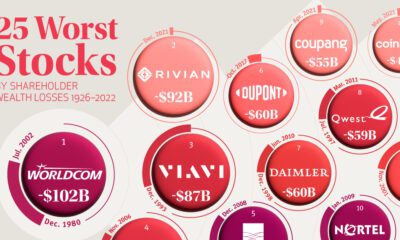

Among publicly-listed U.S. companies, the 25 worst stocks have lost shareholders a collective $1.2 trillion since 1926.
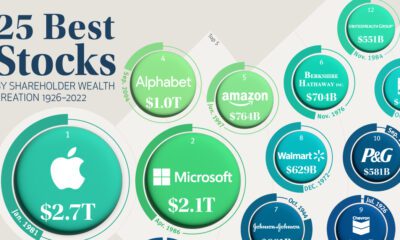

Accounting for just 0.1% of all public U.S. stocks, these companies have created nearly a third of all shareholder wealth since 1926.


We've visualized data from the Federal Reserve to provide a comprehensive break down of U.S. assets by generation.
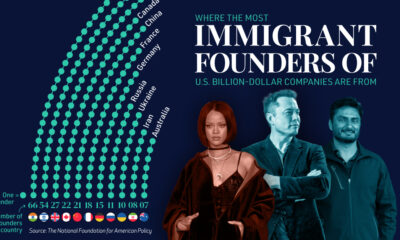

The majority of billion-dollar startups in the U.S. have at least one immigrant founder. Here is where those founders are from.
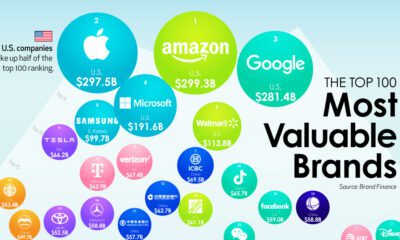

We show the top companies by brand value—and the brands that are rising the fastest as consumer expectations shift.


How does each state contribute to America's overall GDP? This visualization breaks down the U.S. economy by state.


War in Europe has caused Ukraine's military spend to jump up by 640%. How do the world's largest military budgets compare?


In this visual we showcase the relative size of the 100 largest U.S. banks in terms of consolidated assets.
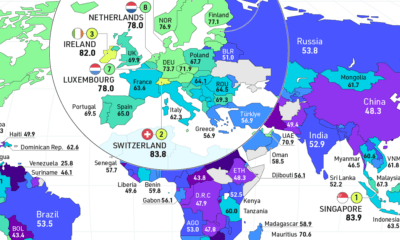

How free are people to control their own labor, property, and finances? This map reveals the state of economic freedom globally.


Nearly 800,000 AI jobs were posted in the U.S. throughout 2022. View this graphic to see a breakdown by state.


OpenAI is now one of the world's top websites, rapidly approaching the level of traffic received by TikTok and Amazon.
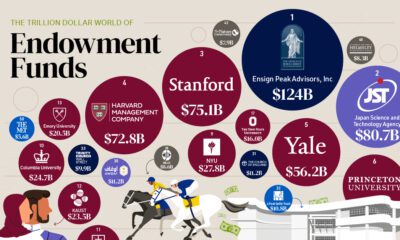

Endowment funds represent the investment arms of nonprofits. See the worlds top 50, which collectively have over $1 trillion in assets.

How many countries globally are true democracies? This map showcases the state of democracy in every country worldwide.
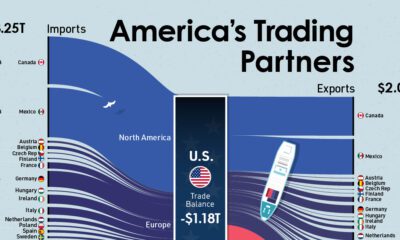

Who are the biggest trading partners of the U.S.? This visual showcases the trade balances between the U.S. and its trading partners.

Foreign investors hold $7.3 trillion of the national U.S. debt. These holdings declined 6% in 2022 amid a strong U.S. dollar and rising rates.
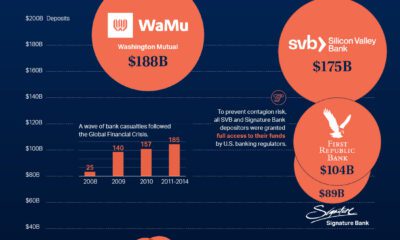

This graphic charts over 560 U.S. bank failures since 2001, including the most recent addition: First Republic Bank.


In this visual, we've ranked the top U.S. metropolitan areas in terms of their GDP. How does your city rank?


From New York to Damascus, this infographic uses EIU cost of living data to rank the world's most and least expensive cities to live in


This infographic compares Tesla's impressive profit margins to various Western and Chinese competitors.
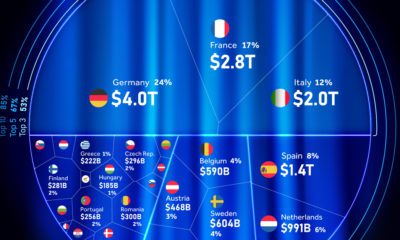

This chart shows the contributors to the EU economy through a percentage-wise distribution of country-level GDP.


In this visualization, we rank the top 50 websites that receive the most internet traffic, from Google to CNN.
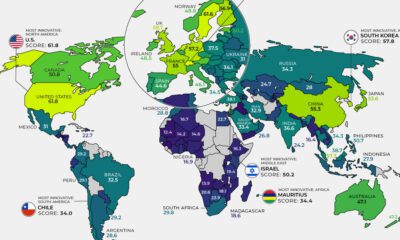

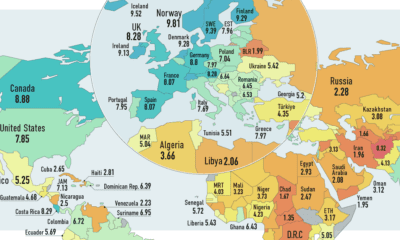
Here are the most innovative countries worldwide and the primary indicators—from patents to R&D spend—driving their breakthroughs.
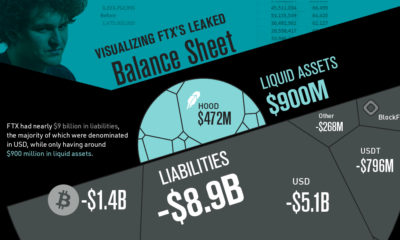

As Sam Bankman-Fried's crypto exchange FTX files for bankruptcy, this graphic visualizes FTX's balance sheet leaked by the Financial Times.


This visualization breaks down how household wealth is distributed around the world. Just 10 countries now account for 75% of total household wealth.


As the world's superpower, the U.S. has major influence in world events. Which foreign policy concerns stand out for Americans?
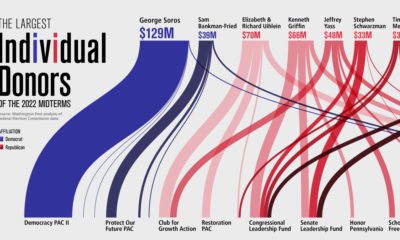

A record-smashing $9 billion has been raised for the 2022 midterm elections. See who the top 10 donors are in this graphic.
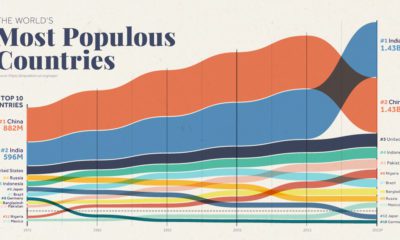

Over the past 50 years, the world's population has doubled, and there have been big changes in the ranking of the world's most populous countries


