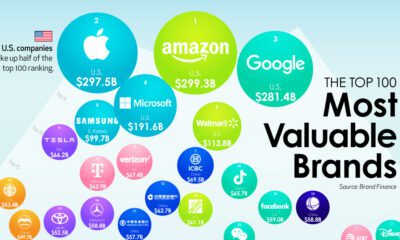

We show the top companies by brand value—and the brands that are rising the fastest as consumer expectations shift.


Empty office space is hitting record highs in 2023. We show almost 1 billion square feet of unused space stacked as a single office tower.


From Apple to Home Depot, we show America’s most profitable companies in their sector at a time of elevated inflation.


Home price growth has moderated amid rising interest rates and a narrow housing supply. Here's how prices compare to historical trends.


S&P 500 companies make up $34 trillion in market value combined. This graphic shows how they break down by weight and sector.
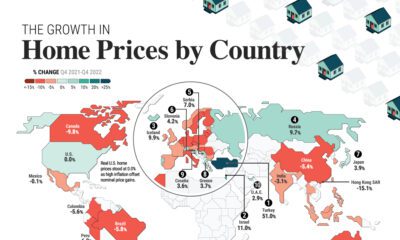

Global house prices were resilient in 2022, rising 6%. We compare nominal and real price growth by country as interest rates surged.
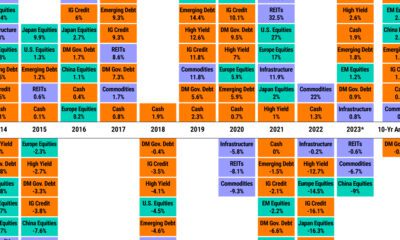

Asset classes vary widely by returns so far in 2023. Which ones are the best-performing, and is a bull market on the horizon?
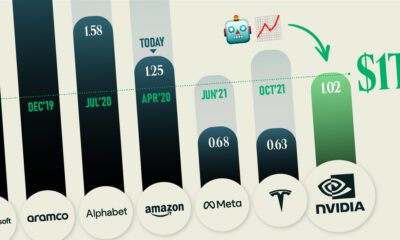

America's biggest chipmaker Nvidia has joined the trillion dollar club as advancements in AI move at lightning speed.
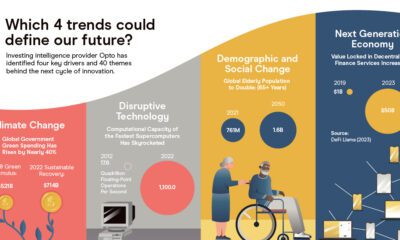

Uncover the next big idea with thematic investing. Explore opportunities in climate change, disruptive innovation, and next-gen tech.
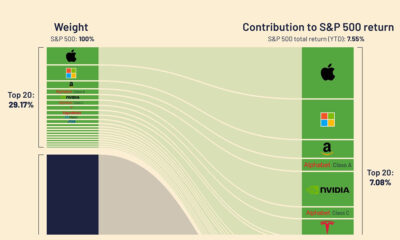

From Apple to NVIDIA, megacap stocks are fueling S&P 500 returns. The majority of these firms are also investing heavily in AI.
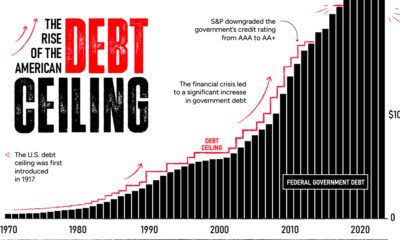

By June 1, a debt ceiling agreement must be finalized. The U.S. could default if politicians fail to act—causing many stark consequences.

How can investors prepare for a market downturn? What goes into a recession investment strategy? We look at three sectors to consider.
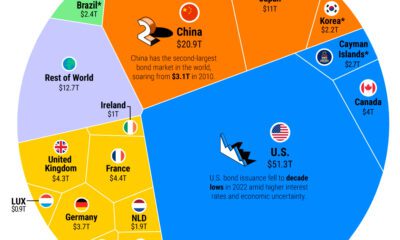

The global bond market stands at $133 trillion in value. Here are the major players in bond markets worldwide.
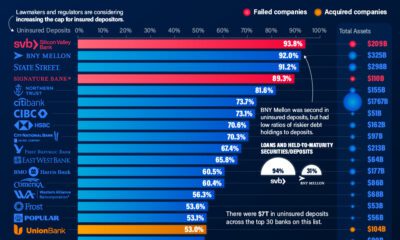

Uninsured deposits in the U.S. total at least $7 trillion. We show the top 30 banks with the highest level of these deposits.
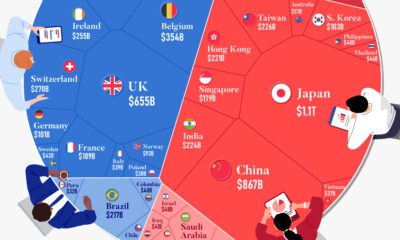

Foreign investors hold $7.3 trillion of the national U.S. debt. These holdings declined 6% in 2022 amid a strong U.S. dollar and rising rates.
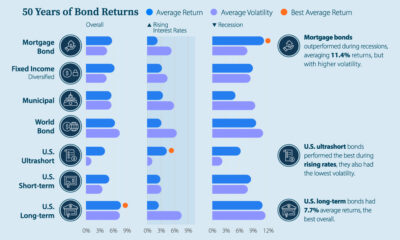

What factors impact the bond market? Here's how current interest rates, bond returns, and market volatility compare in a historical context.


How have investment returns for different portfolio allocations of stocks and bonds compared over the last 90 years?
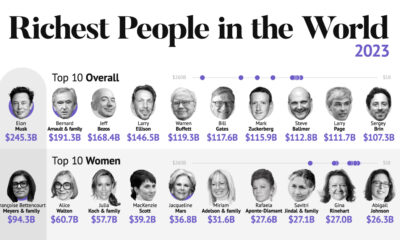

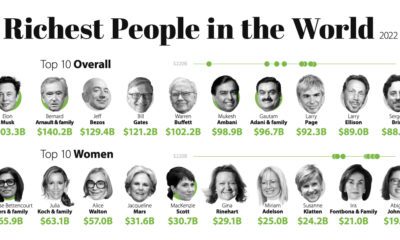
The world's five richest people are worth a combined $871 billion. From luxury moguls to Asia's rising titans, we show the richest in 2023.
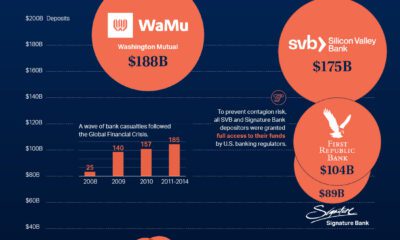

This graphic charts over 560 U.S. bank failures since 2001, including the most recent addition: First Republic Bank.
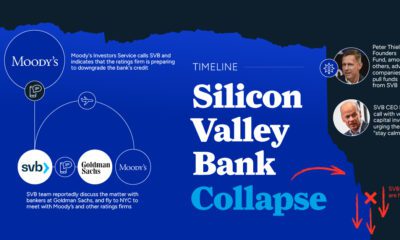

Silicon Valley Bank was shuttered by regulators becoming the largest bank to fail since the height of the Financial Crisis. What happened?
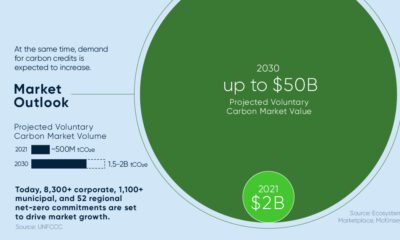

To reach net-zero by 2050, trillions in annual investment will be required. Here’s how carbon credits help close this funding gap.


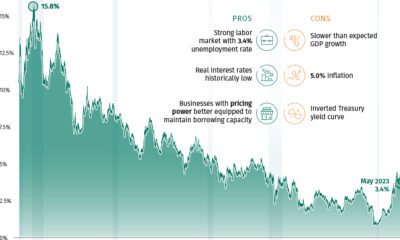
The U.S. labor market is remarkably strong, with a 3.4% unemployment rate. Which sectors are seeing the highest job gains in 2023?


Just four economies around the world had inflation below 2% in 2022. We show the countries with the lowest inflation globally.


Unemployment is forecast to tick higher in 2023, but so far red-hot labor markets are resisting this trend on a global scale.


The global economy faces an uncertain future in 2023. This year, GDP growth is projected to be 2.9%—down from 3.2% in 2022.


Since 2008, the value of unrecorded dollar debt has doubled. Here's why this is increasing risk in global financial markets.


Who made it to the top? Here are the world's most valuable public companies in 2022 as the year comes to an end.
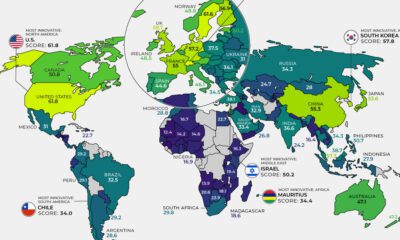

Here are the most innovative countries worldwide and the primary indicators—from patents to R&D spend—driving their breakthroughs.
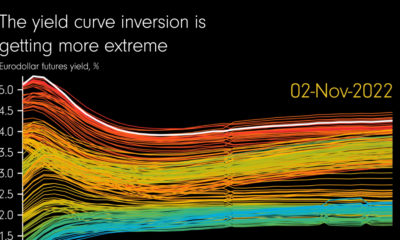

Since 1960, an inverted yield curve has preceded nearly every recession. This animation highlights how that inversion is becoming more extreme.


Many countries around the world are facing double or triple-digit inflation. See which countries have the highest inflation rates on this map.
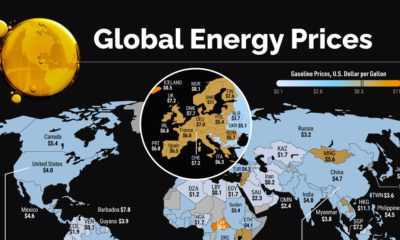

Energy prices have been extremely volatile in 2022. Which countries are seeing the highest prices in the world?
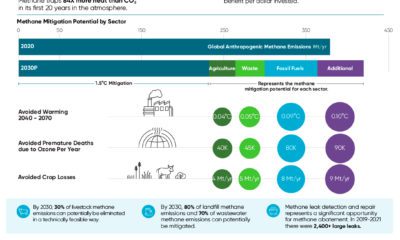

Methane emissions contribute to over half of net global warming. Where do the greatest opportunities lie for methane abatement?


From the wealth held to billionaires to all debt in the global financial system, we look at the vast universe of money and markets in 2022.

The Federal Reserve has raised U.S. interest rates five times in 2022, but how do today’s levels compare to historical interest rates?
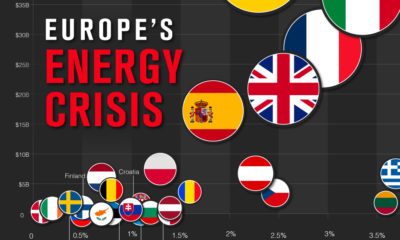

As European gas prices soar, countries are introducing policies to try and curb the energy crisis.
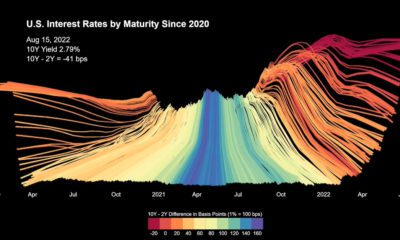

U.S. interest rates have risen sharply after sitting near historic lows. This animation charts their trajectory since 2020.
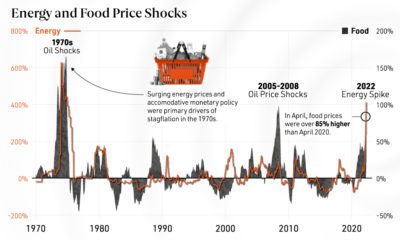

From rising inflation to food insecurity, we show why energy price shocks have far-reaching effects on the global economy.


From regenerative farming to recycled materials, here's how leaders in luxury fashion are building sustainable supply chains.
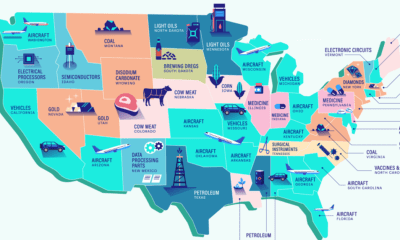

From Nevada gold to Maine’s top-tier lobsters, here are America’s top exports by state.
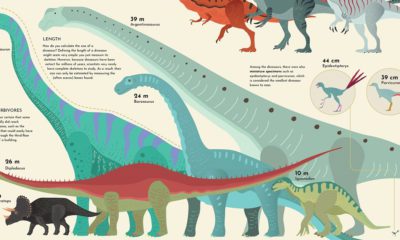

The largest dinosaur that ever lived was as long as a 13-story building. We show how the sizes of dinosaurs measured up.
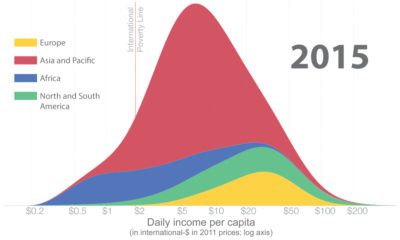

How has global income distribution changed over history? Below, we show three distinct periods since the Industrial Revolution.
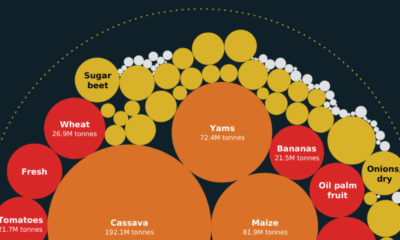

From wheat to cassavas, also known as yuca, here are the top cash crops in Africa and their share of global production.
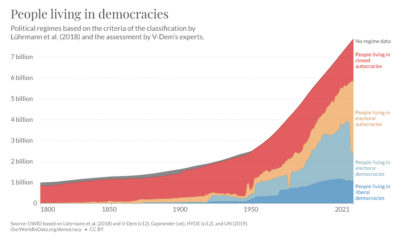

Are political democracies on the decline? This graphic shows the global composition of political regimes over 200 years.
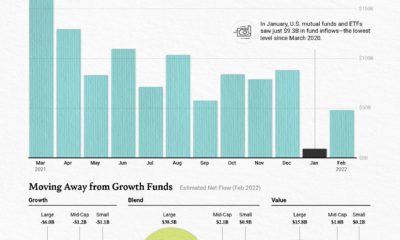

With the Ukraine crisis unfolding and rising interest rates on the horizon, investors are moving out of U.S. equity funds.

Elon Musk. MacKenzie Bezos. Zhang Yiming. This infographic is a snapshot of the richest people in the world during this turbulent time.
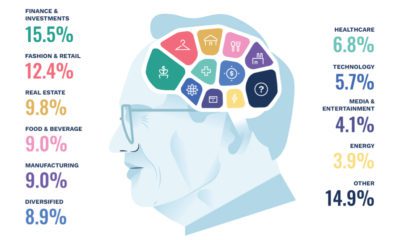

From Warren Buffett to Elon Musk, this graphic shows the world’s billionaires based on their top sectors, residence, and net worth.
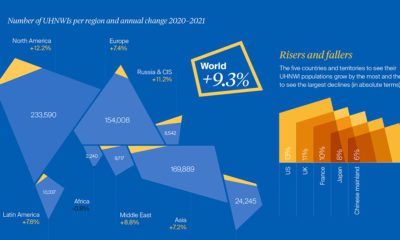

The global pool of ultra-high-net-worth individuals (UHNWI) has skyrocketed 75% in five years. In 2021 alone, it jumped 9.3%.
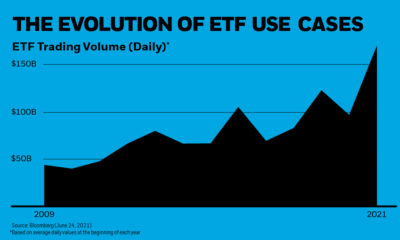

From complementing derivatives to bond sourcing, we show a growing set of ETF use cases over the last several decades.
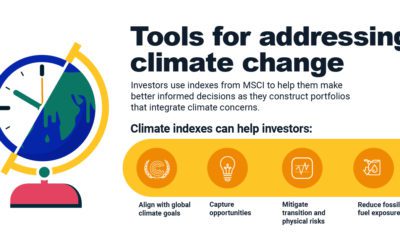

What are the different types of climate indexes? We show their key metrics and how they can help investors align with net-zero goals.
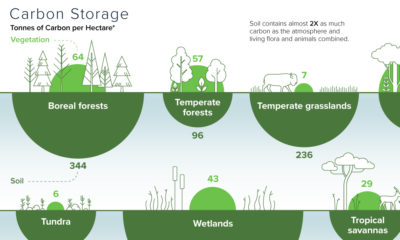

Forests are vital carbon sinks, soaking up about 40% of all emissions annually. Here is the carbon storage of ecosystems around the world.


 Creator Program